著名医師による解説が無料で読めます
すると翻訳の精度が向上します
皮質のエコー源性は、皮質構造の変化を示唆する腎ソノグラムを解釈する上で重要なパラメーターです。エコー源性は現在定性的に測定されており、定量化の試みは行われていません。肝臓に関連して腎皮質エコー源性を定量化する方法を開発し、その再現性、スキャン変数への依存性、および潜在的な有用性を評価しました。右腎臓のソノグラムがデジタル化され、腎皮質と肝臓の領域の平均ピクセル密度が測定され、グレースケールに正規化されました。エコー源性は、皮質の明るさ(平均ピクセル密度の逆)と肝臓の輝度の比(平均ピクセル密度の逆)として表されました。同じ研究の複数のソノグラムで実行された測定値間の平均変動係数は2.8%であり、1年間で同じ腎臓で実行された複数の測定値間の変動係数は1.8%でした。同一の画像上の2人の異なる個人によって得られた測定値間の相関は0.92で、平均変動は3.0%でした。エコー源性は、スキャナーまたはプローブの頻度の種類によって大きな影響を受けませんでしたが、ゲインと逆に変化しました。ただし、ゲインの効果は有用な範囲内で非常に小さかった。一晩の速い速度後の水負荷は、すべての場合にエコー源性を増加させ、平均6.4%増加しました。正常な腎臓のエコー源性は肝臓のエコー源よりも有意に少なかった(範囲、0.810〜0.987)、臨床ソノグラムでは、遡及的にしかし盲目的に分析された、エコー源性は元々割り当てられたエコー源性の定性的グラデーションと相関していた。最もエコー因性腎臓は、通常の腎臓よりも62%明るく、測定の変動性よりも多くの倍も大きくなりました。腎皮質エコー源性の定量化は実現可能で再現可能であり、腎疾患の検出および後期に役立つ可能性があると結論付けます。腎皮質のエコー源性は、健康な被験者の肝臓のエコー源よりも少なく、利尿の状態の影響を受けます。
皮質のエコー源性は、皮質構造の変化を示唆する腎ソノグラムを解釈する上で重要なパラメーターです。エコー源性は現在定性的に測定されており、定量化の試みは行われていません。肝臓に関連して腎皮質エコー源性を定量化する方法を開発し、その再現性、スキャン変数への依存性、および潜在的な有用性を評価しました。右腎臓のソノグラムがデジタル化され、腎皮質と肝臓の領域の平均ピクセル密度が測定され、グレースケールに正規化されました。エコー源性は、皮質の明るさ(平均ピクセル密度の逆)と肝臓の輝度の比(平均ピクセル密度の逆)として表されました。同じ研究の複数のソノグラムで実行された測定値間の平均変動係数は2.8%であり、1年間で同じ腎臓で実行された複数の測定値間の変動係数は1.8%でした。同一の画像上の2人の異なる個人によって得られた測定値間の相関は0.92で、平均変動は3.0%でした。エコー源性は、スキャナーまたはプローブの頻度の種類によって大きな影響を受けませんでしたが、ゲインと逆に変化しました。ただし、ゲインの効果は有用な範囲内で非常に小さかった。一晩の速い速度後の水負荷は、すべての場合にエコー源性を増加させ、平均6.4%増加しました。正常な腎臓のエコー源性は肝臓のエコー源よりも有意に少なかった(範囲、0.810〜0.987)、臨床ソノグラムでは、遡及的にしかし盲目的に分析された、エコー源性は元々割り当てられたエコー源性の定性的グラデーションと相関していた。最もエコー因性腎臓は、通常の腎臓よりも62%明るく、測定の変動性よりも多くの倍も大きくなりました。腎皮質エコー源性の定量化は実現可能で再現可能であり、腎疾患の検出および後期に役立つ可能性があると結論付けます。腎皮質のエコー源性は、健康な被験者の肝臓のエコー源よりも少なく、利尿の状態の影響を受けます。
The echogenicity of the cortex is an important parameter in interpreting renal sonograms that suggest changes in cortical structure. Echogenicity is currently measured qualitatively, and no attempts have been made at quantification. We developed a method to quantify renal cortical echogenicity in reference to the liver and evaluated its reproducibility, dependence on scanning variables, and potential utility. Sonograms of the right kidney were digitized, and the mean pixel density of regions of the renal cortex and liver was measured and normalized to the gray scale. Echogenicity was expressed as the ratio of the brightness (inverse of mean pixel density) of the cortex to that of the liver. The mean coefficient of variation among measurements performed on multiple sonograms from the same study was 2.8%, and the coefficient of variation among multiple measurements performed on the same kidney over 1 year was 1.8%. The correlation between measurements obtained by two different individuals on identical images was 0.92, with a mean variation of 3.0%. Echogenicity was not significantly affected by type of scanner or probe frequency, but varied inversely with gain. However, the effect of gain was very small within the useful range. Water loading after an overnight fast increased echogenicity in all cases, with a mean increase of 6.4%. Echogenicity of normal kidneys was significantly less than that of the liver (range, 0.810 to 0.987), and in clinical sonograms analyzed retrospectively but blindly, echogenicity correlated with the qualitative gradations of echogenicity originally assigned. The most echogenic kidneys were 62% brighter than normal kidneys, many times greater than the variability of the measurement. We conclude that quantification of renal cortical echogenicity is feasible and reproducible and may be useful in detecting and following renal disease. Echogenicity of the renal cortex is less than that of the liver in healthy subjects and is influenced by the state of diuresis.
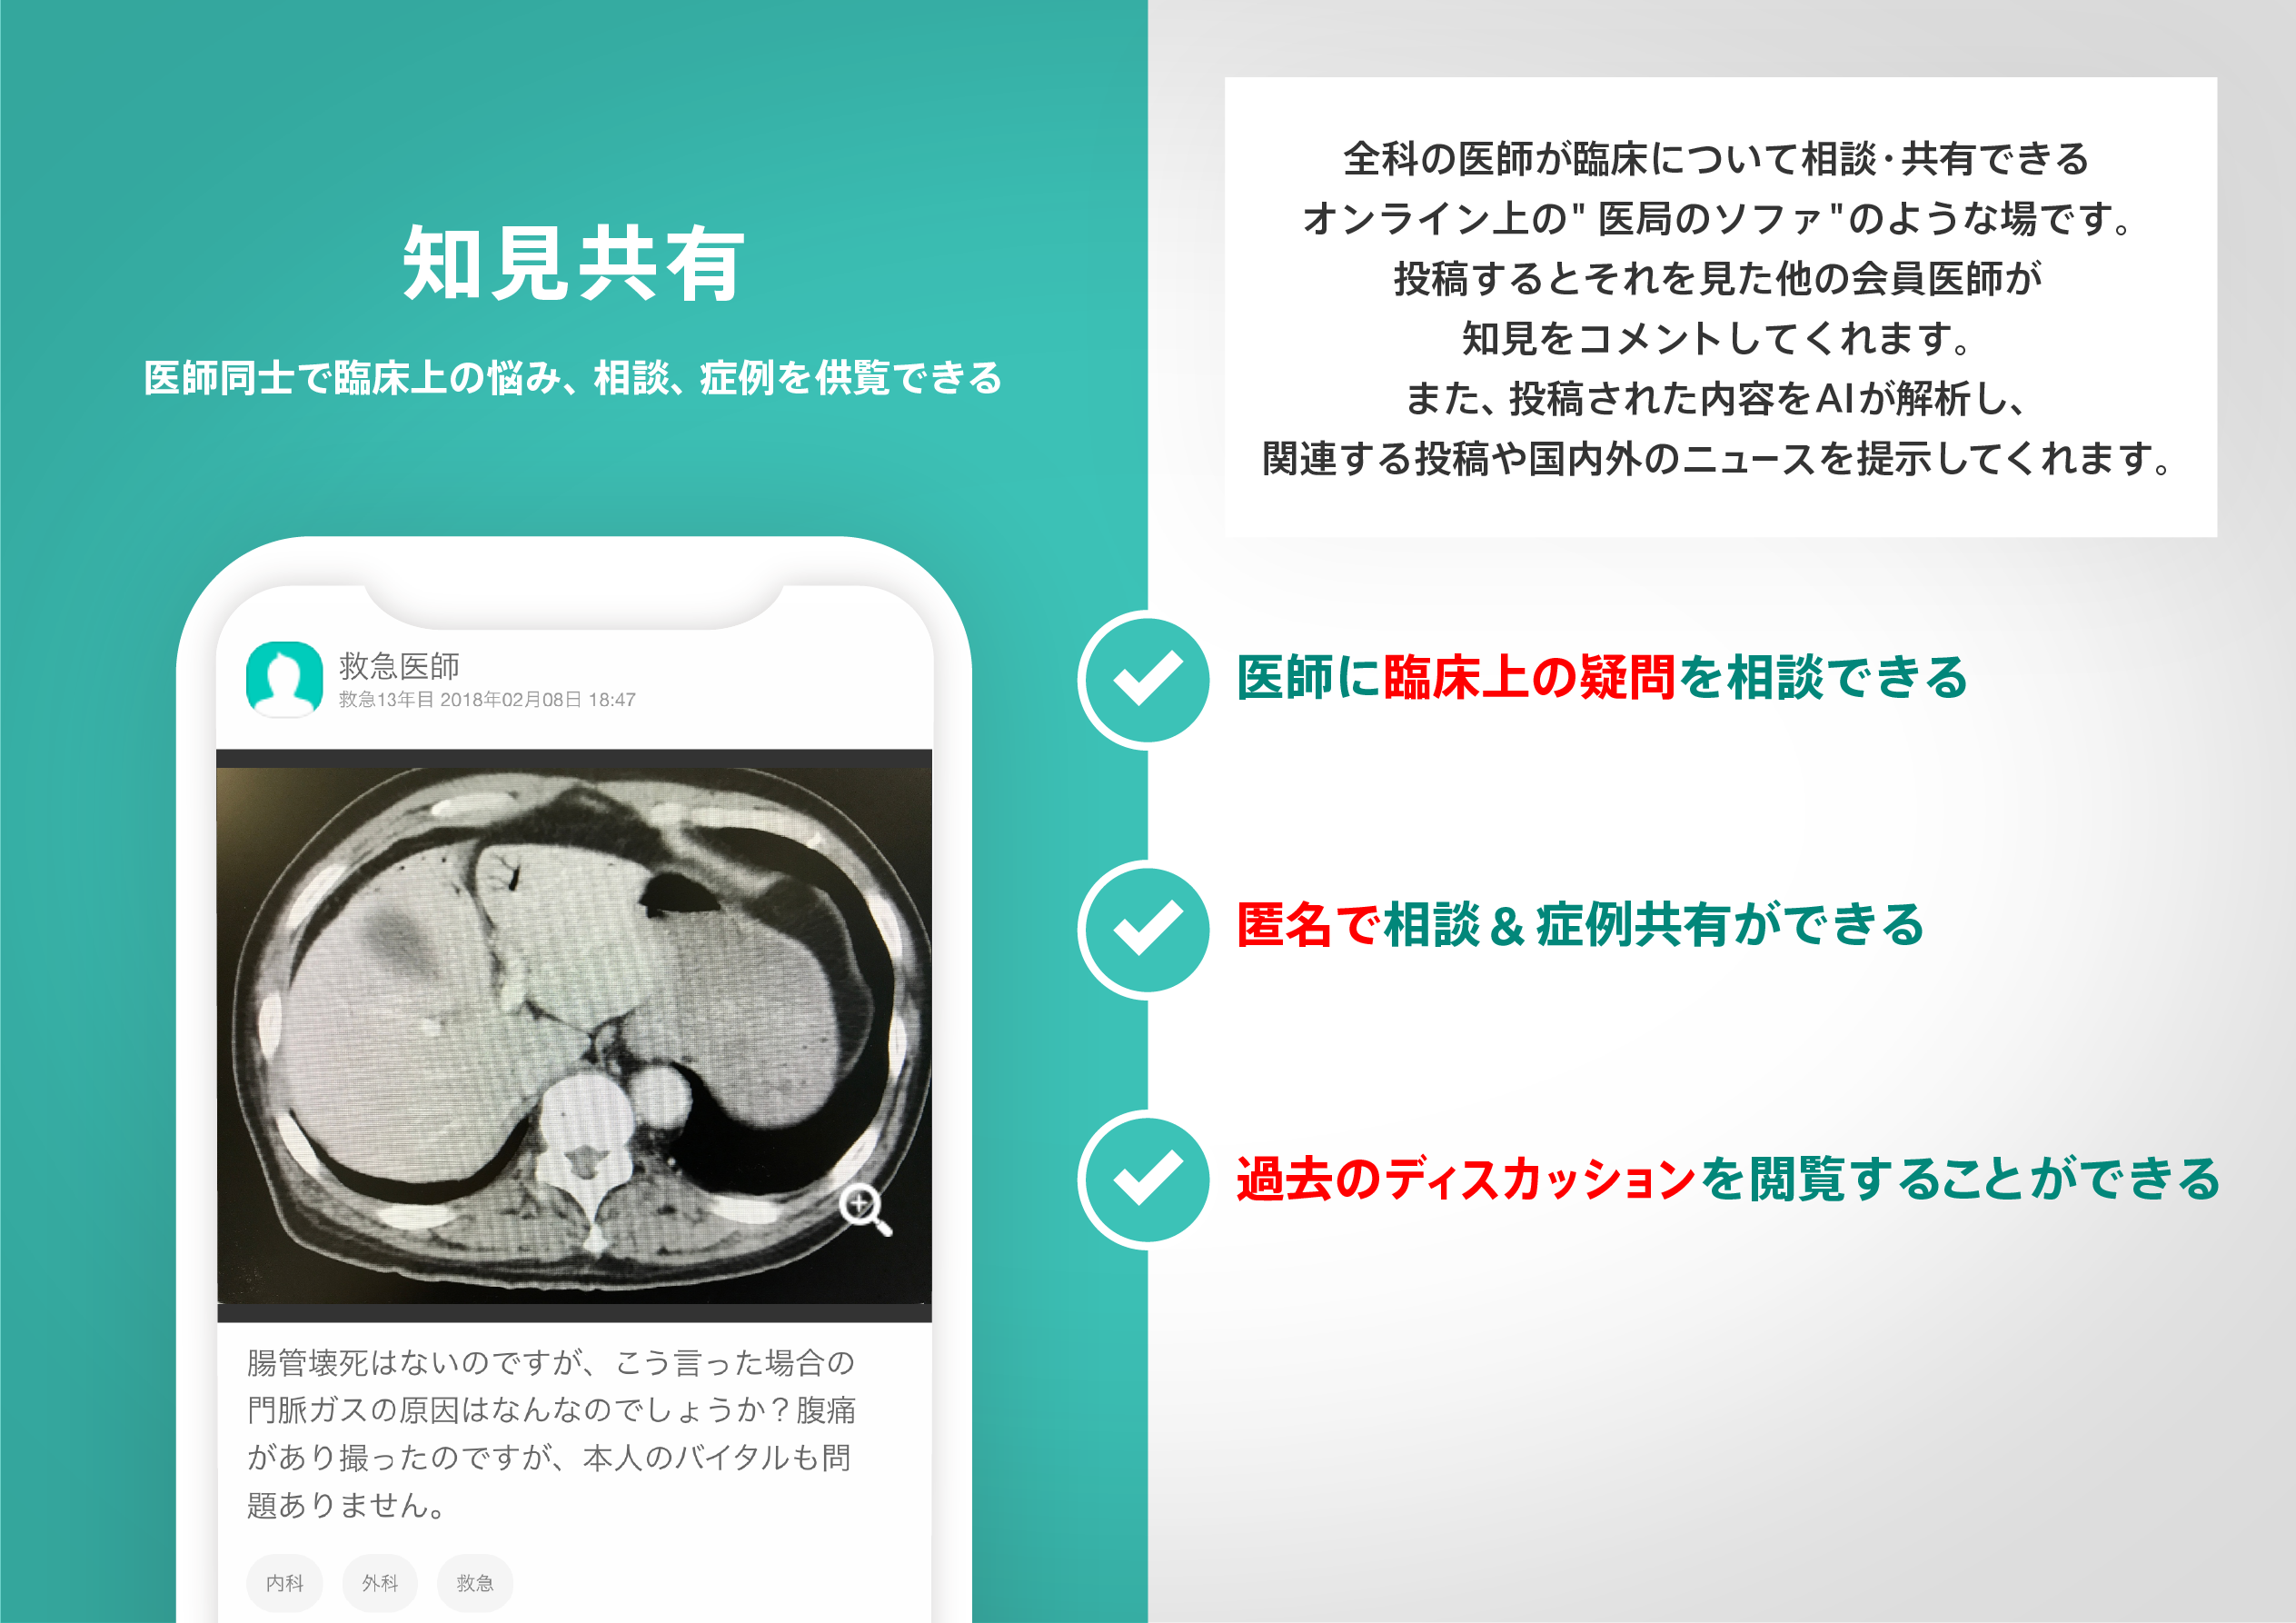
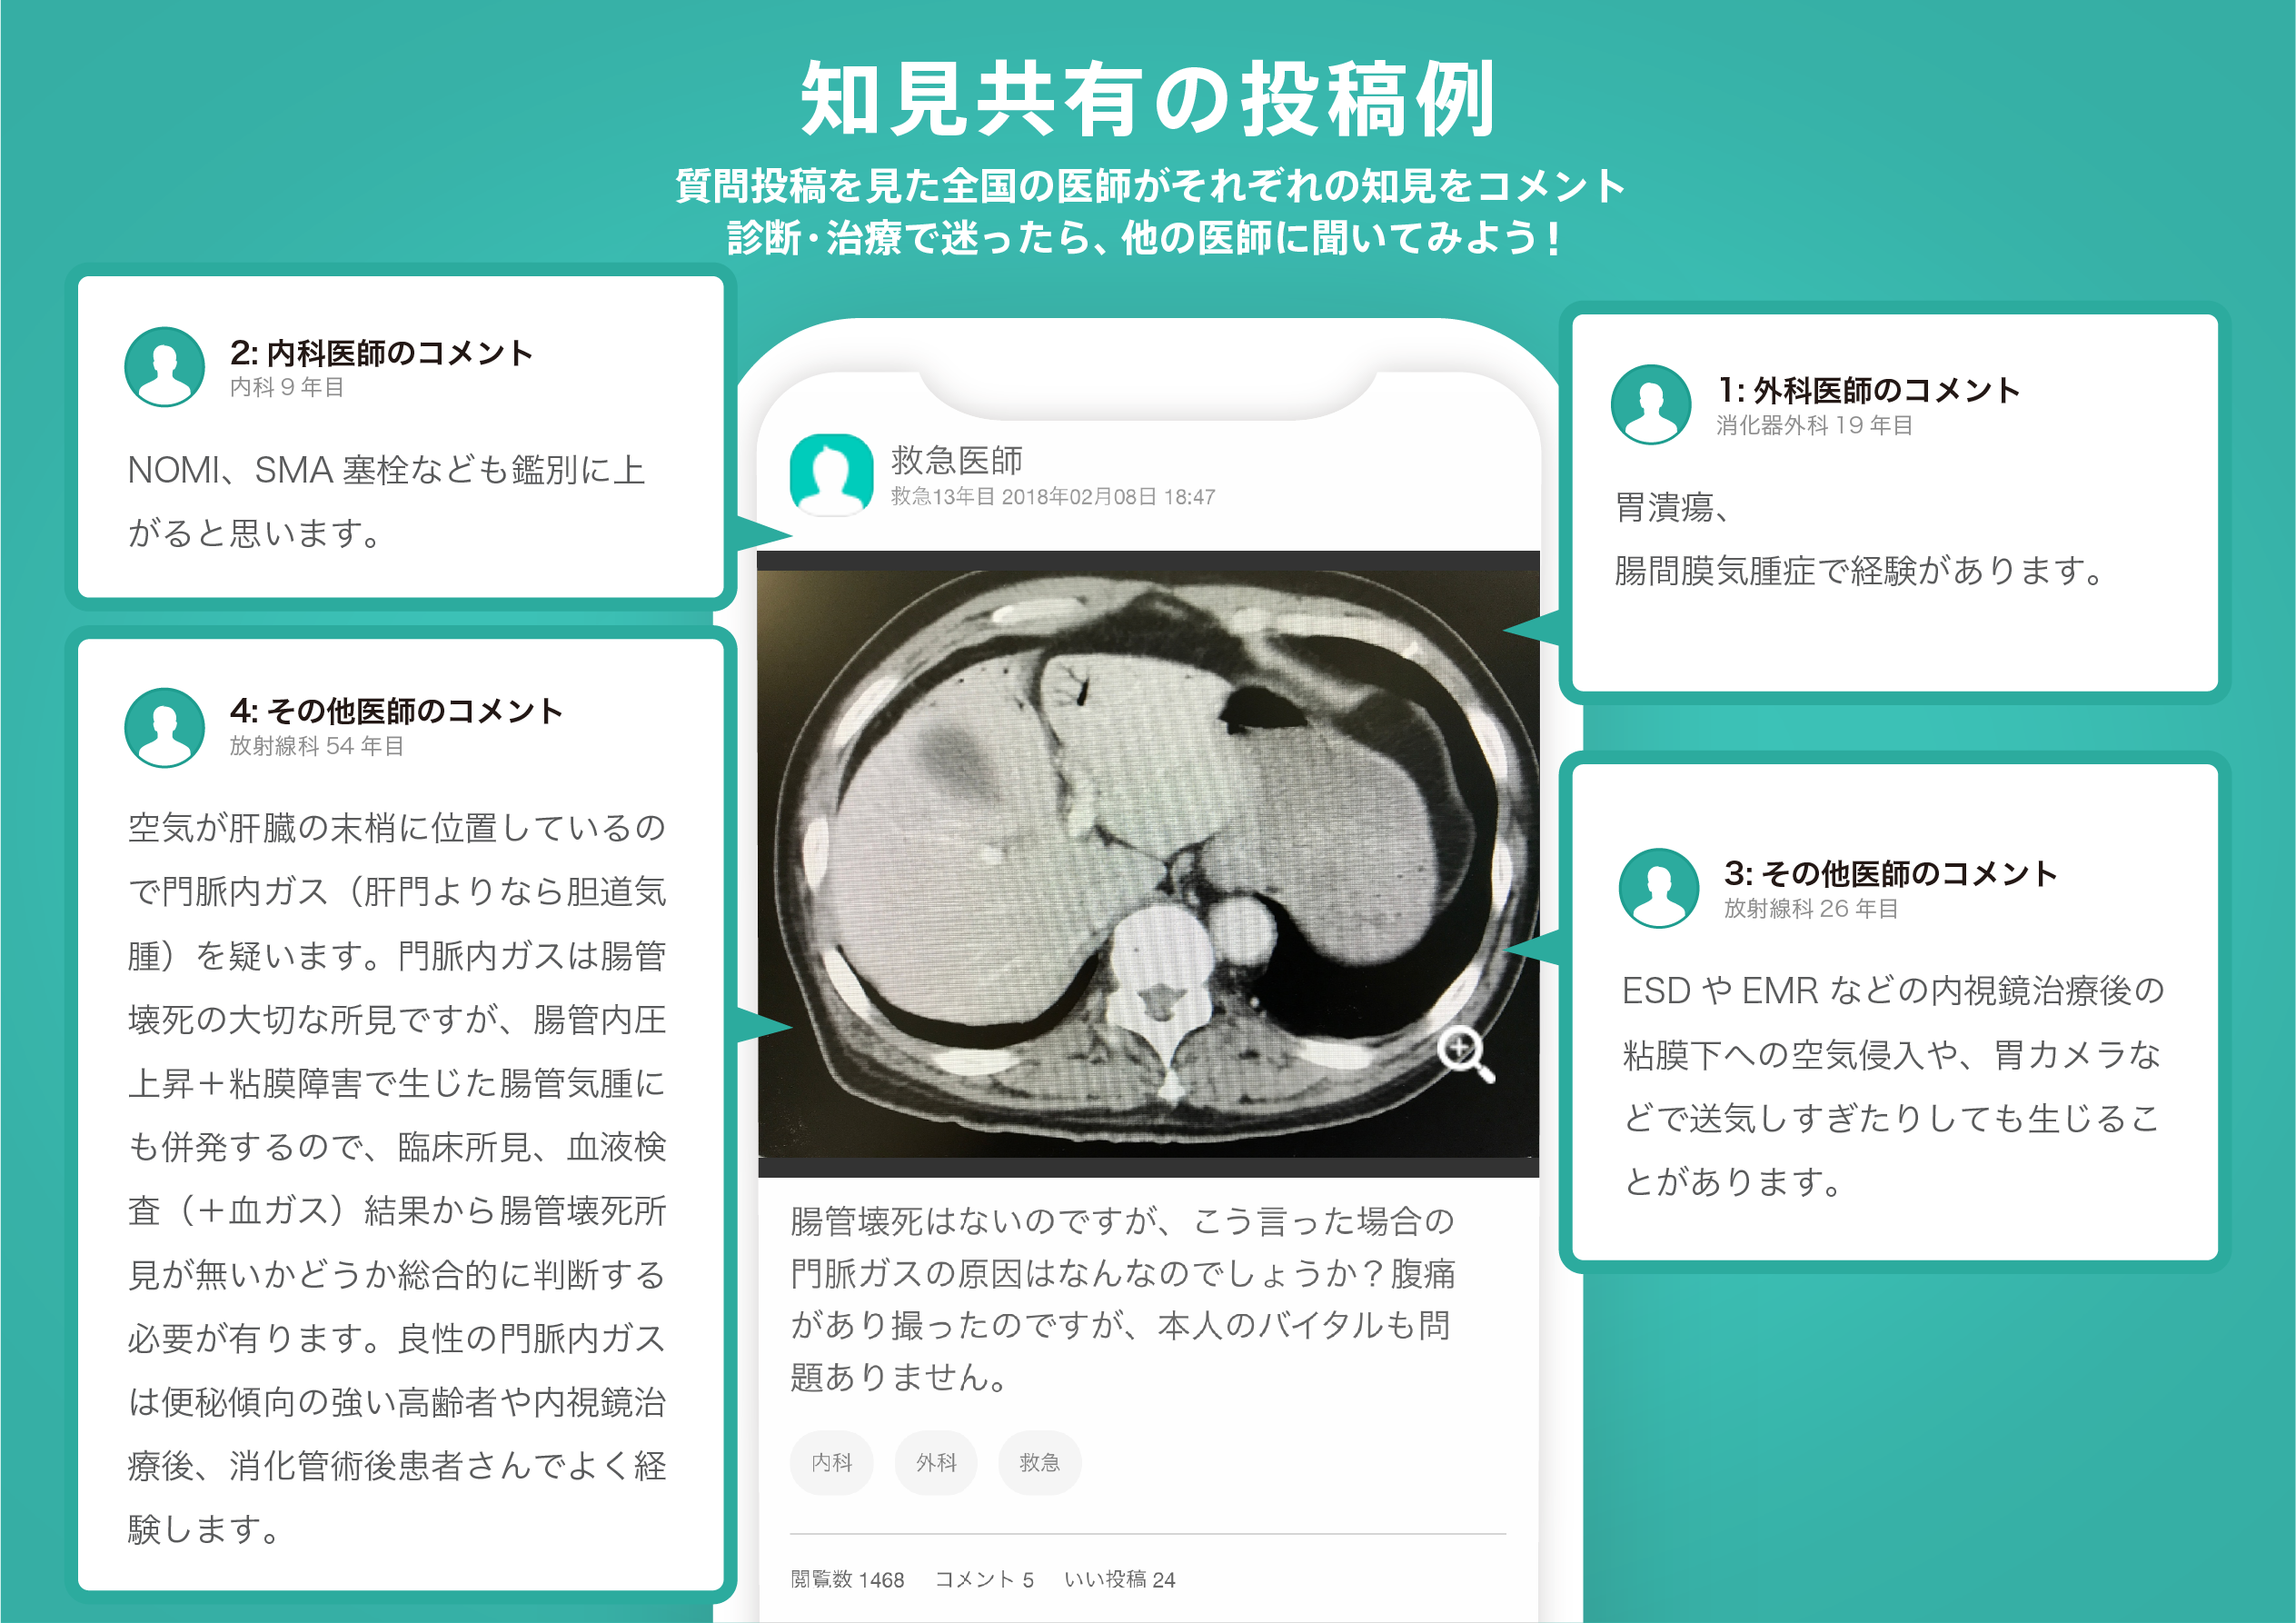
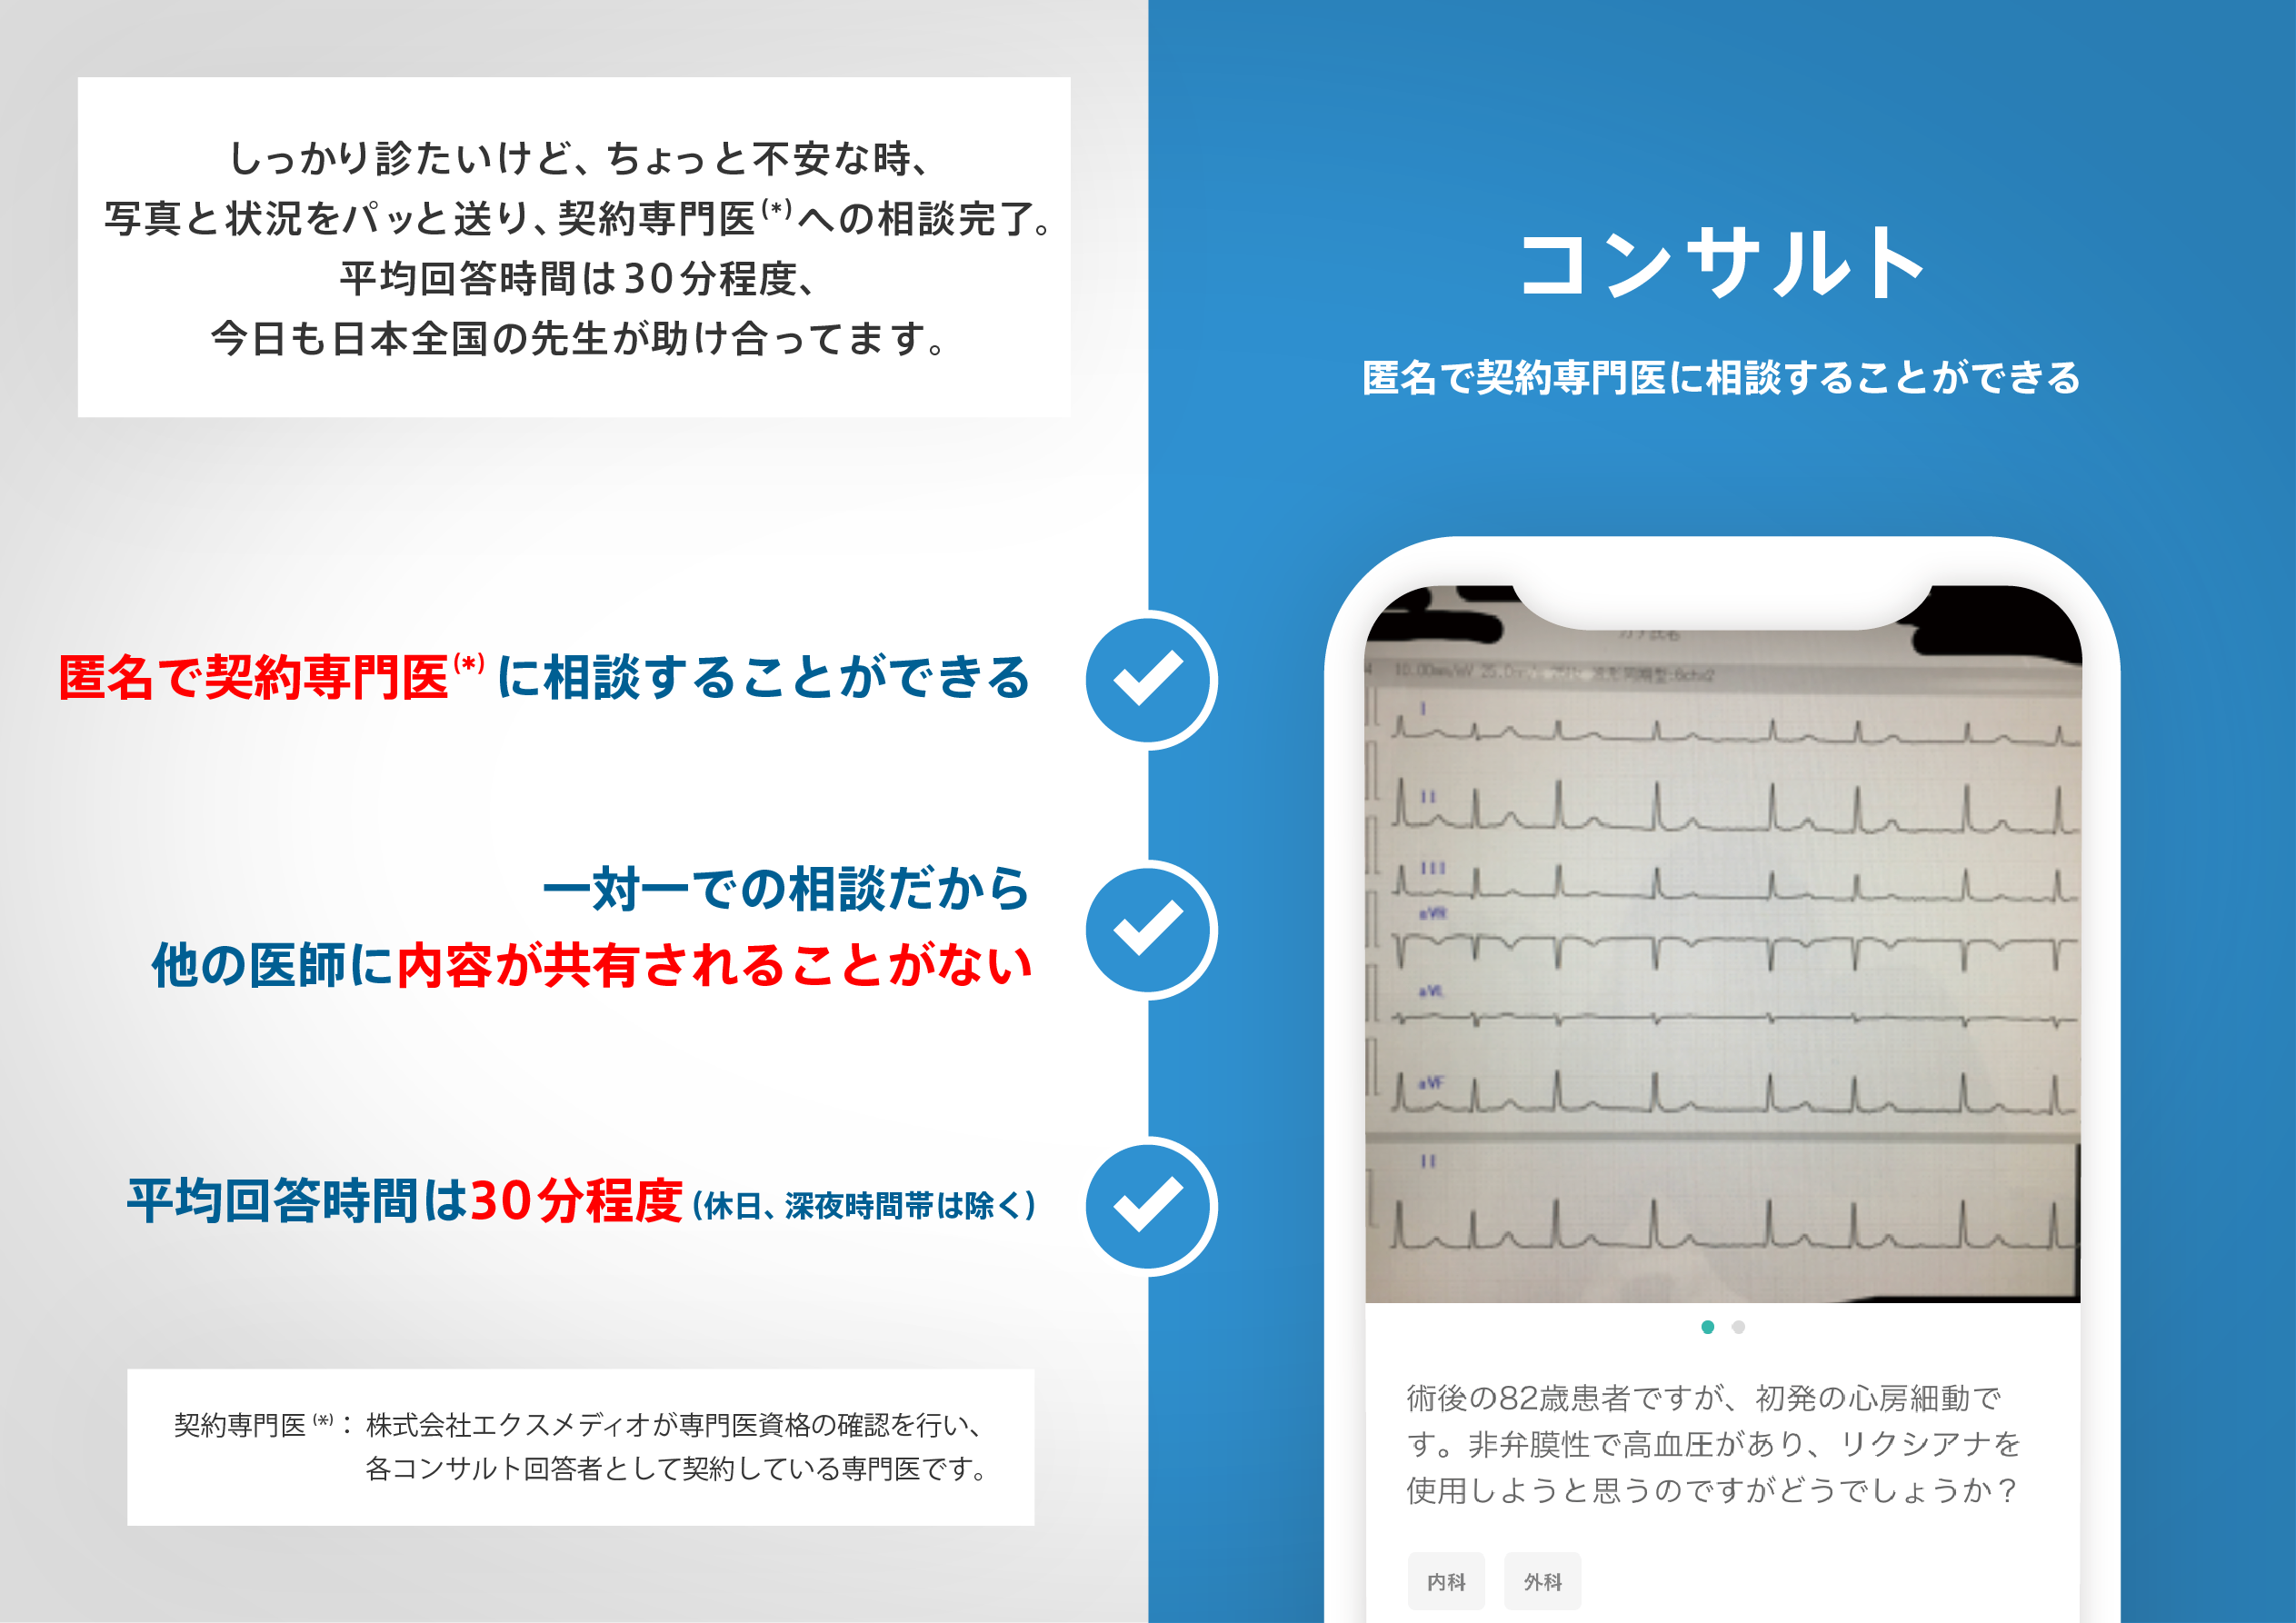
医師のための臨床サポートサービス
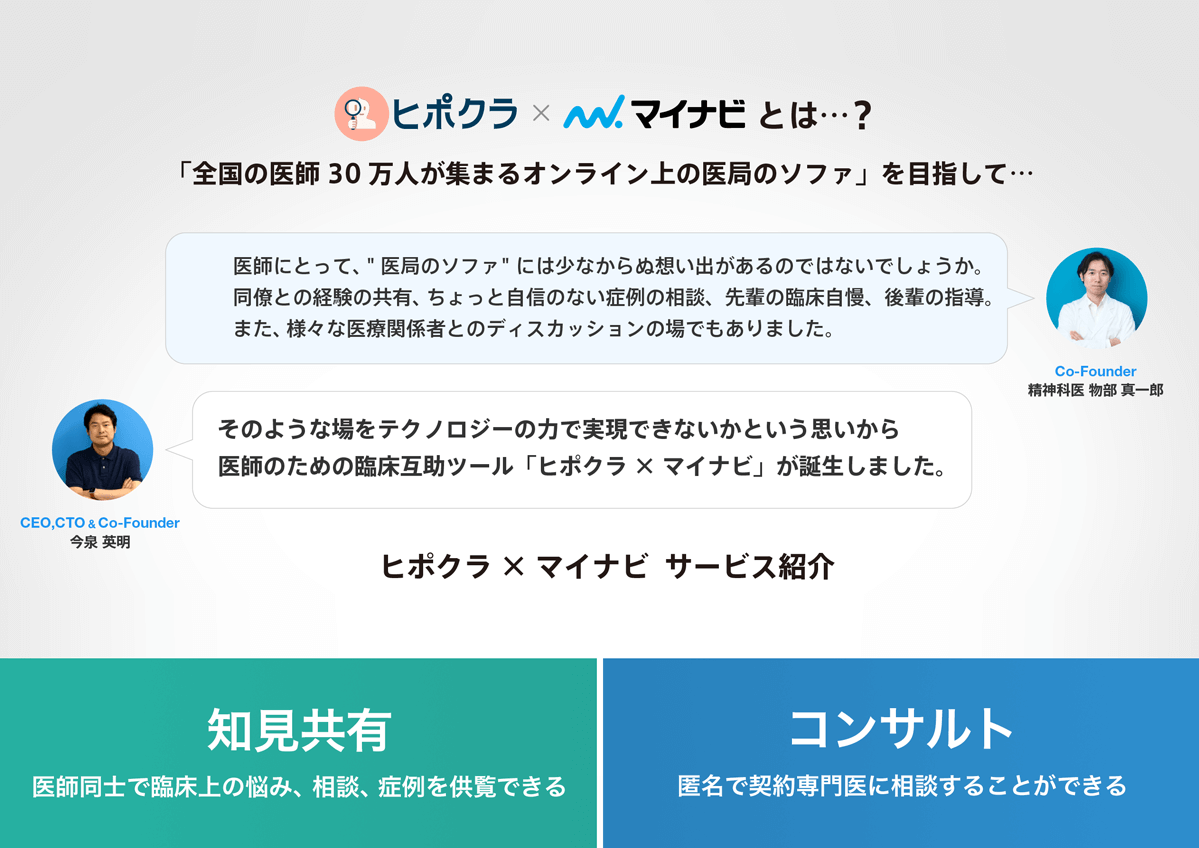
ヒポクラ x マイナビのご紹介
無料会員登録していただくと、さらに便利で効率的な検索が可能になります。

