著名医師による解説が無料で読めます
すると翻訳の精度が向上します
医薬品開発におけるハイスループットスクリーニングの場合、分析作業を減らすことができる方法が望ましいです。分析のための単一のサンプルを生成するための時間領域の個々の被験者からの血漿サンプルのプールを使用して、濃度時間曲線(AUC)の下で面積を推定しています。最初のモーメント曲線(AUMC)の下での面積を推定するためのプーリング手順について説明します。平均滞留時間(MRT)、および静脈内投与が使用されている場合、定常状態の分布量を決定できます。私たちの研究室で分析された犬と人間の薬物動態研究の血漿サンプルを使用して、プールアプローチを検証しました。プロキネティックなマクロライドとその3つの代謝物を含む各プラズマサンプルを最初に個別に分析し、線形台形ルールを使用してAUCSとAUMCを計算しました。サンプルプーリングによるAUCの推定手順は、Riadらによって報告されています。[Pharm。解像度。(1991)Vol。8、pp。541-543]。AUMCの推定では、プールされたサンプルを形成するためにnサンプルのそれぞれから取得した体積は、アリコートの体積があるt0を除き、t(n)(t(n+1)-t(n -1))に比例します。0およびt(last)では、アリコートボリュームはt(last)(t(last)-t((last)-1))に比例します。t(last)からt(last)はc(プール)x t2/2に等しく、tは全体的な実験時間(t(t(last)-t0)です。AUMCとAUCの比率は、平均滞留時間(MRT)を生成します。二変量(直交)回帰分析を使用して、プーリング法と線形台形ルールとの間の一致を評価しました。バイアスとルート平均平方根誤差を使用して、プーリング方法を検証しました。プーリング(y軸)によって決定されるAUMC値の直交回帰分析と線形台形ルール(x軸)によって推定された値は、犬サンプルの1.08およびR2の勾配と0.994の勾配を生成しました。勾配値は、ヒトサンプルで0.862から0.928およびR2値の0.838から0.988の範囲でした。割合として表されるバイアスは、-25.1%から14.8%の範囲で、全体の平均は1.40%でした。結果は、平均プラズマ濃度を定量化する際のプールサンプル技術の使用をサポートして、サンプリング期間にわたって最初のモーメント曲線の下で曲線と領域を推定することをサポートしています。その後、平均滞留時間を計算できます。
医薬品開発におけるハイスループットスクリーニングの場合、分析作業を減らすことができる方法が望ましいです。分析のための単一のサンプルを生成するための時間領域の個々の被験者からの血漿サンプルのプールを使用して、濃度時間曲線(AUC)の下で面積を推定しています。最初のモーメント曲線(AUMC)の下での面積を推定するためのプーリング手順について説明します。平均滞留時間(MRT)、および静脈内投与が使用されている場合、定常状態の分布量を決定できます。私たちの研究室で分析された犬と人間の薬物動態研究の血漿サンプルを使用して、プールアプローチを検証しました。プロキネティックなマクロライドとその3つの代謝物を含む各プラズマサンプルを最初に個別に分析し、線形台形ルールを使用してAUCSとAUMCを計算しました。サンプルプーリングによるAUCの推定手順は、Riadらによって報告されています。[Pharm。解像度。(1991)Vol。8、pp。541-543]。AUMCの推定では、プールされたサンプルを形成するためにnサンプルのそれぞれから取得した体積は、アリコートの体積があるt0を除き、t(n)(t(n+1)-t(n -1))に比例します。0およびt(last)では、アリコートボリュームはt(last)(t(last)-t((last)-1))に比例します。t(last)からt(last)はc(プール)x t2/2に等しく、tは全体的な実験時間(t(t(last)-t0)です。AUMCとAUCの比率は、平均滞留時間(MRT)を生成します。二変量(直交)回帰分析を使用して、プーリング法と線形台形ルールとの間の一致を評価しました。バイアスとルート平均平方根誤差を使用して、プーリング方法を検証しました。プーリング(y軸)によって決定されるAUMC値の直交回帰分析と線形台形ルール(x軸)によって推定された値は、犬サンプルの1.08およびR2の勾配と0.994の勾配を生成しました。勾配値は、ヒトサンプルで0.862から0.928およびR2値の0.838から0.988の範囲でした。割合として表されるバイアスは、-25.1%から14.8%の範囲で、全体の平均は1.40%でした。結果は、平均プラズマ濃度を定量化する際のプールサンプル技術の使用をサポートして、サンプリング期間にわたって最初のモーメント曲線の下で曲線と領域を推定することをサポートしています。その後、平均滞留時間を計算できます。
For high-throughput screening in drug development, methods that can reduce analytical work are desirable. Pooling of plasma samples from an individual subject in the time domain to yield a single sample for analysis has been used to estimate the area under the concentration-time curve (AUC). We describe a pooling procedure for the estimation of the area under the first moment curve (AUMC). The mean residence time (MRT), and where intravenous dosing has been used, the steady-state volume of distribution can then be determined. Plasma samples from pharmacokinetic studies in dogs and humans analyzed in our laboratory were used to validate the pooling approach. Each plasma sample containing a prokinetic macrolide and three of its metabolites was first analyzed separately, and AUCs and AUMCs were calculated using the linear trapezoidal rule. The procedures for the estimation of AUC by sample pooling have been reported by Riad et al. [Pharm. Res. (1991) vol. 8, pp. 541-543]. For the estimation of AUMC, the volume taken from each of n samples to form a pooled sample is proportional to t(n)(t(n+1) - t(n-1)), except at t0 where the aliquot volume is 0 and at t(last) where the aliquot volume is proportional to t(last)(t(last) - t((last)-1)). AUMC to t(last) is equal to C(pooled) x T2/2, where T is the overall experimental time (t(last) - t0). The ratio between AUMC and AUC yields the mean residence time (MRT). Bivariate (orthogonal) regression analysis was used to assess agreement between the pooling method and the linear trapezoidal rule. Bias and root mean square error were used to validate the pooling method. Orthogonal regression analysis of the AUMC values determined by pooling (y-axis) and those estimated by the linear trapezoidal rule (x-axis) yielded a slope of 1.08 and r2 of 0.994 for the dog samples; slope values ranged from 0.862 to 0.928 and r2 values from 0.838 to 0.988 for the human samples. Bias, expressed as percentage, ranged from -25.1% to 14.8% with an overall average of 1.40%. The results support the use of a pooled-sample technique in quantitating the average plasma concentration to estimate areas under the curve and areas under the first moment curve over the sampling time period. Mean residence times can then be calculated.
医師のための臨床サポートサービス
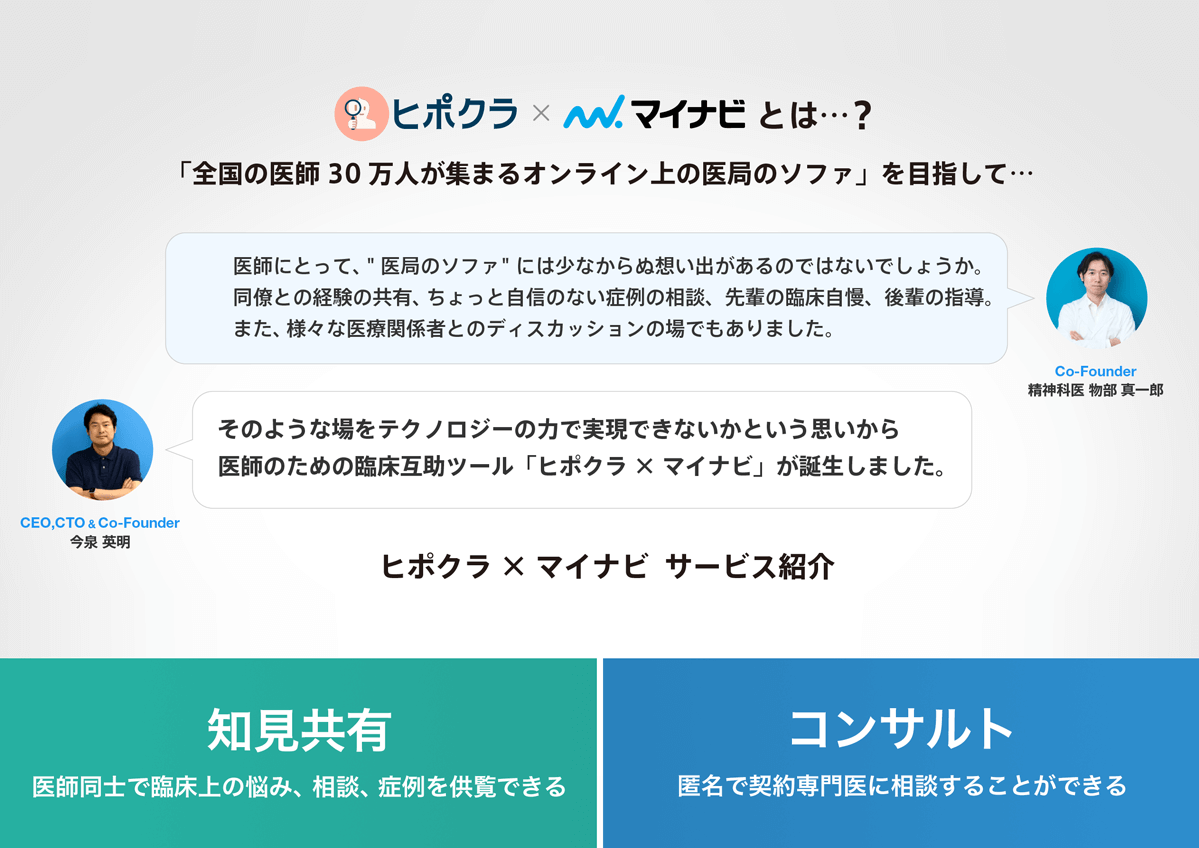
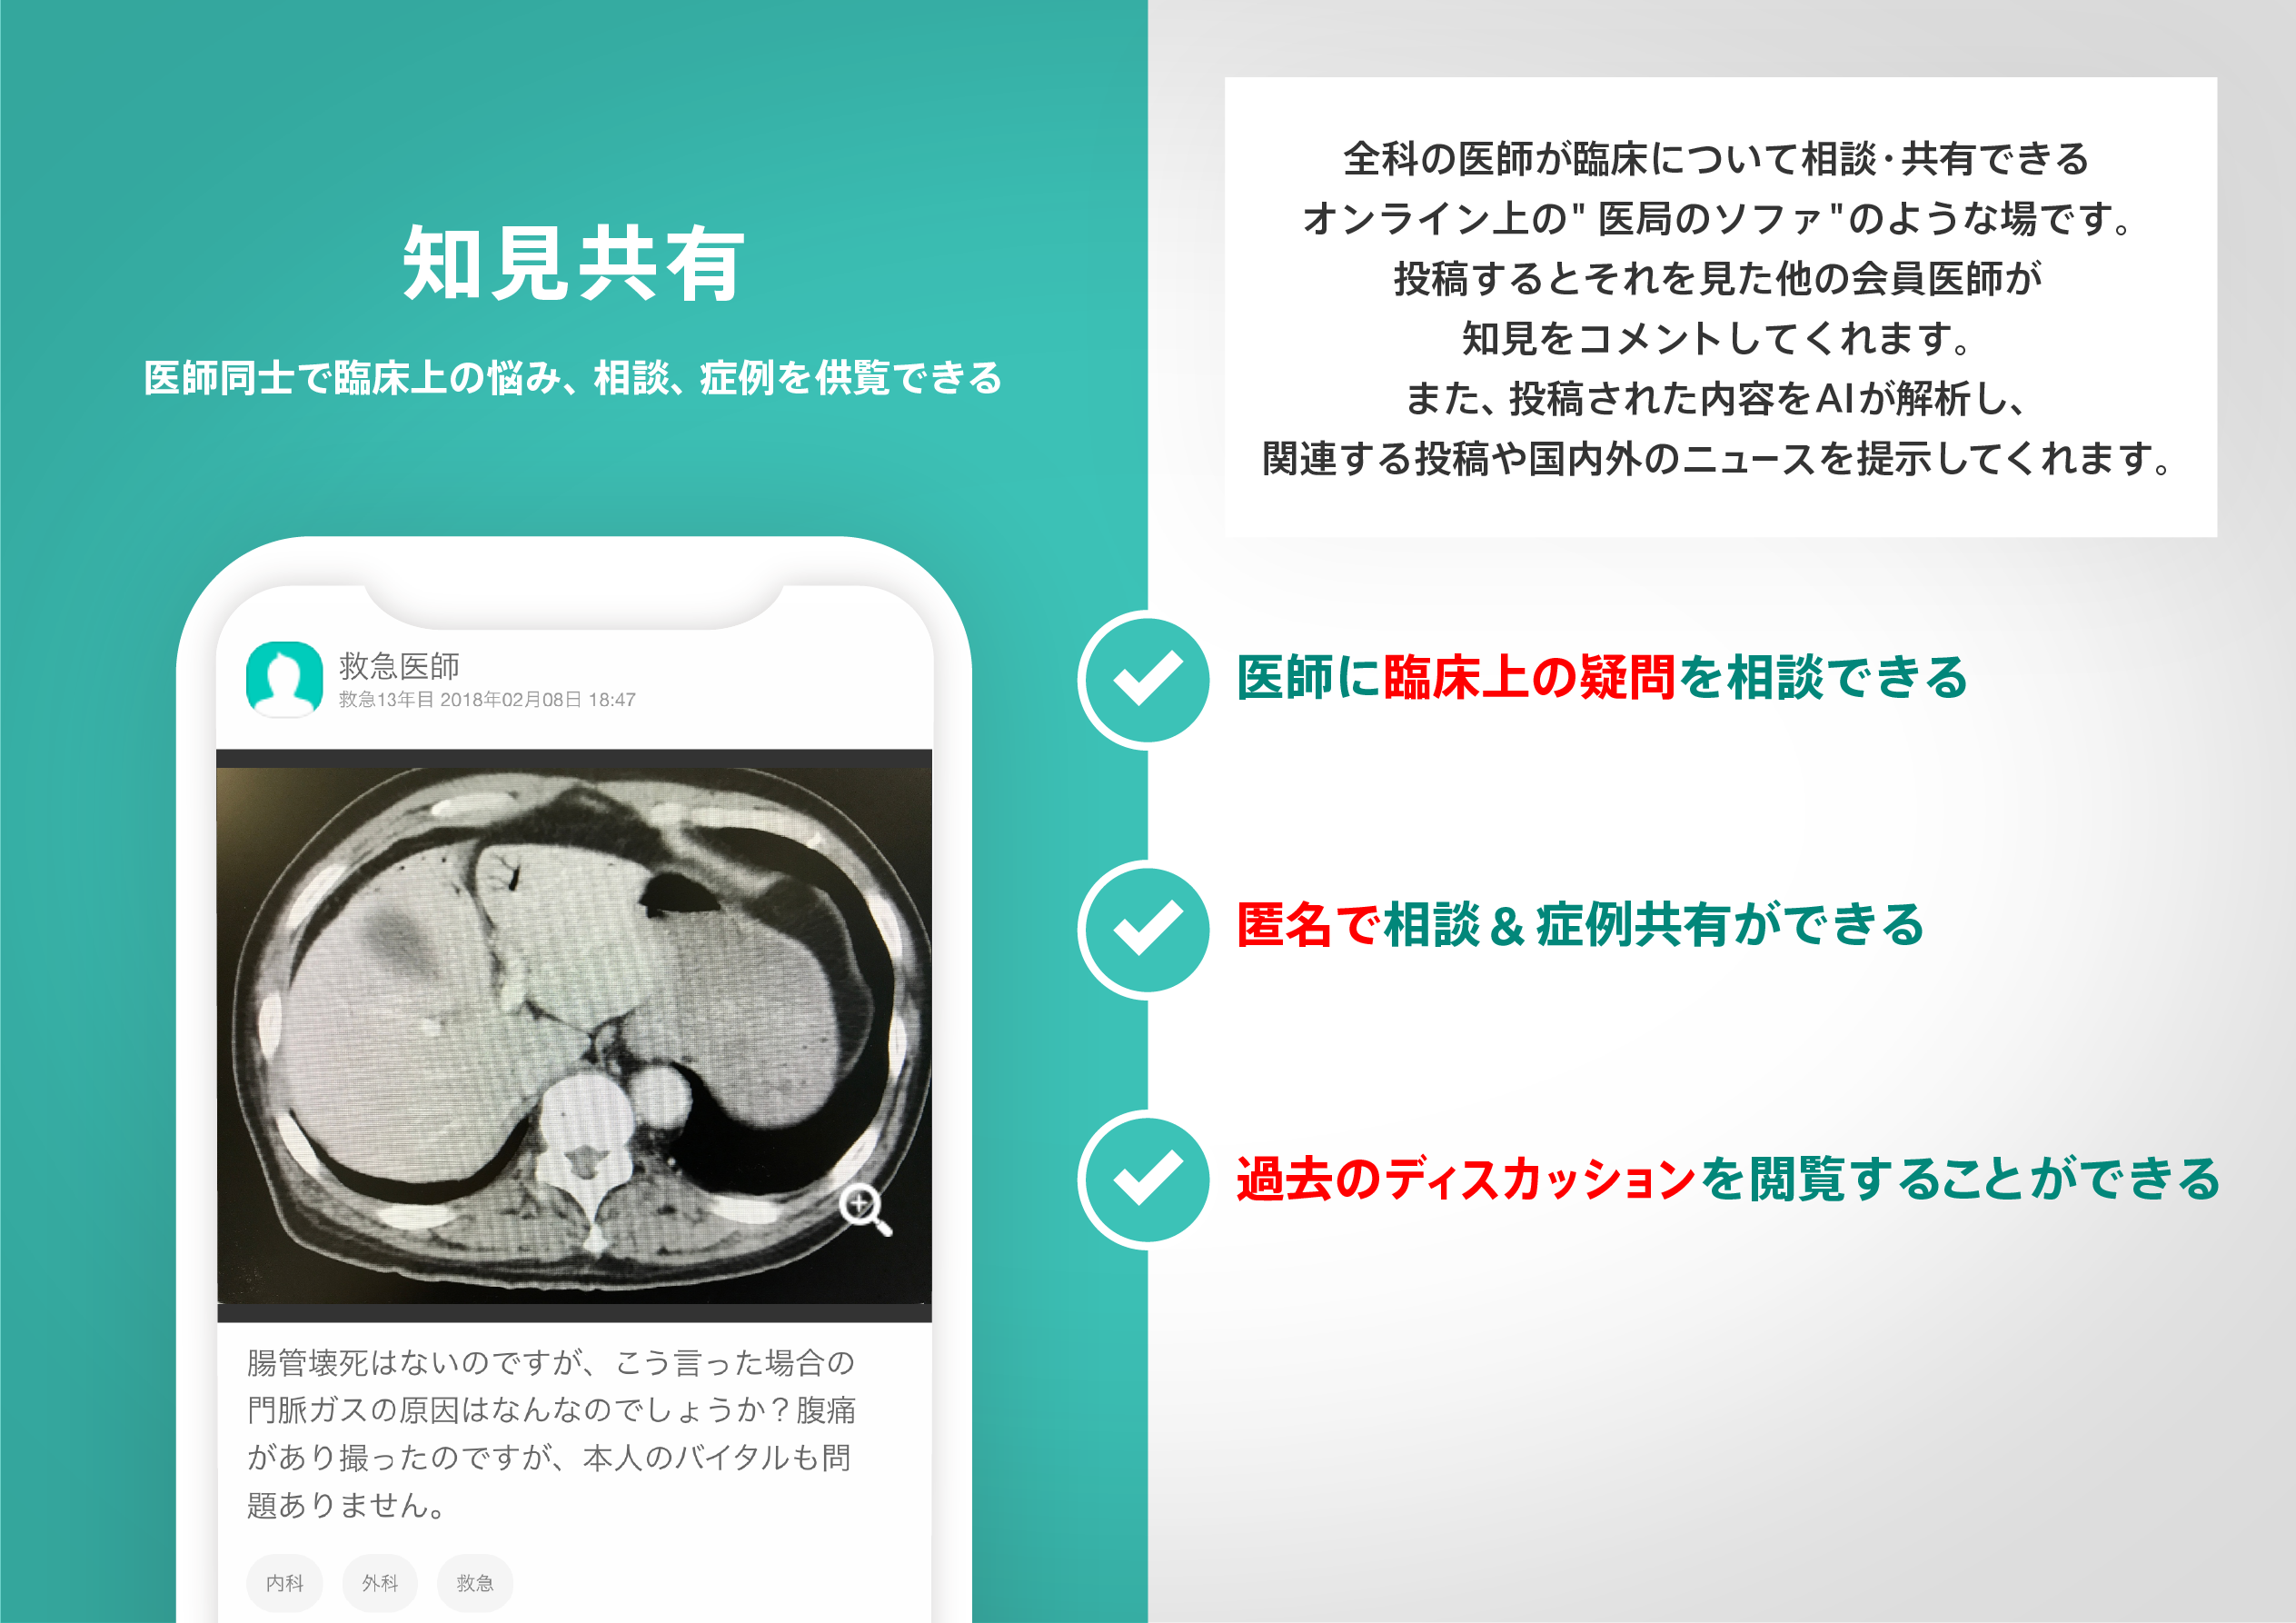
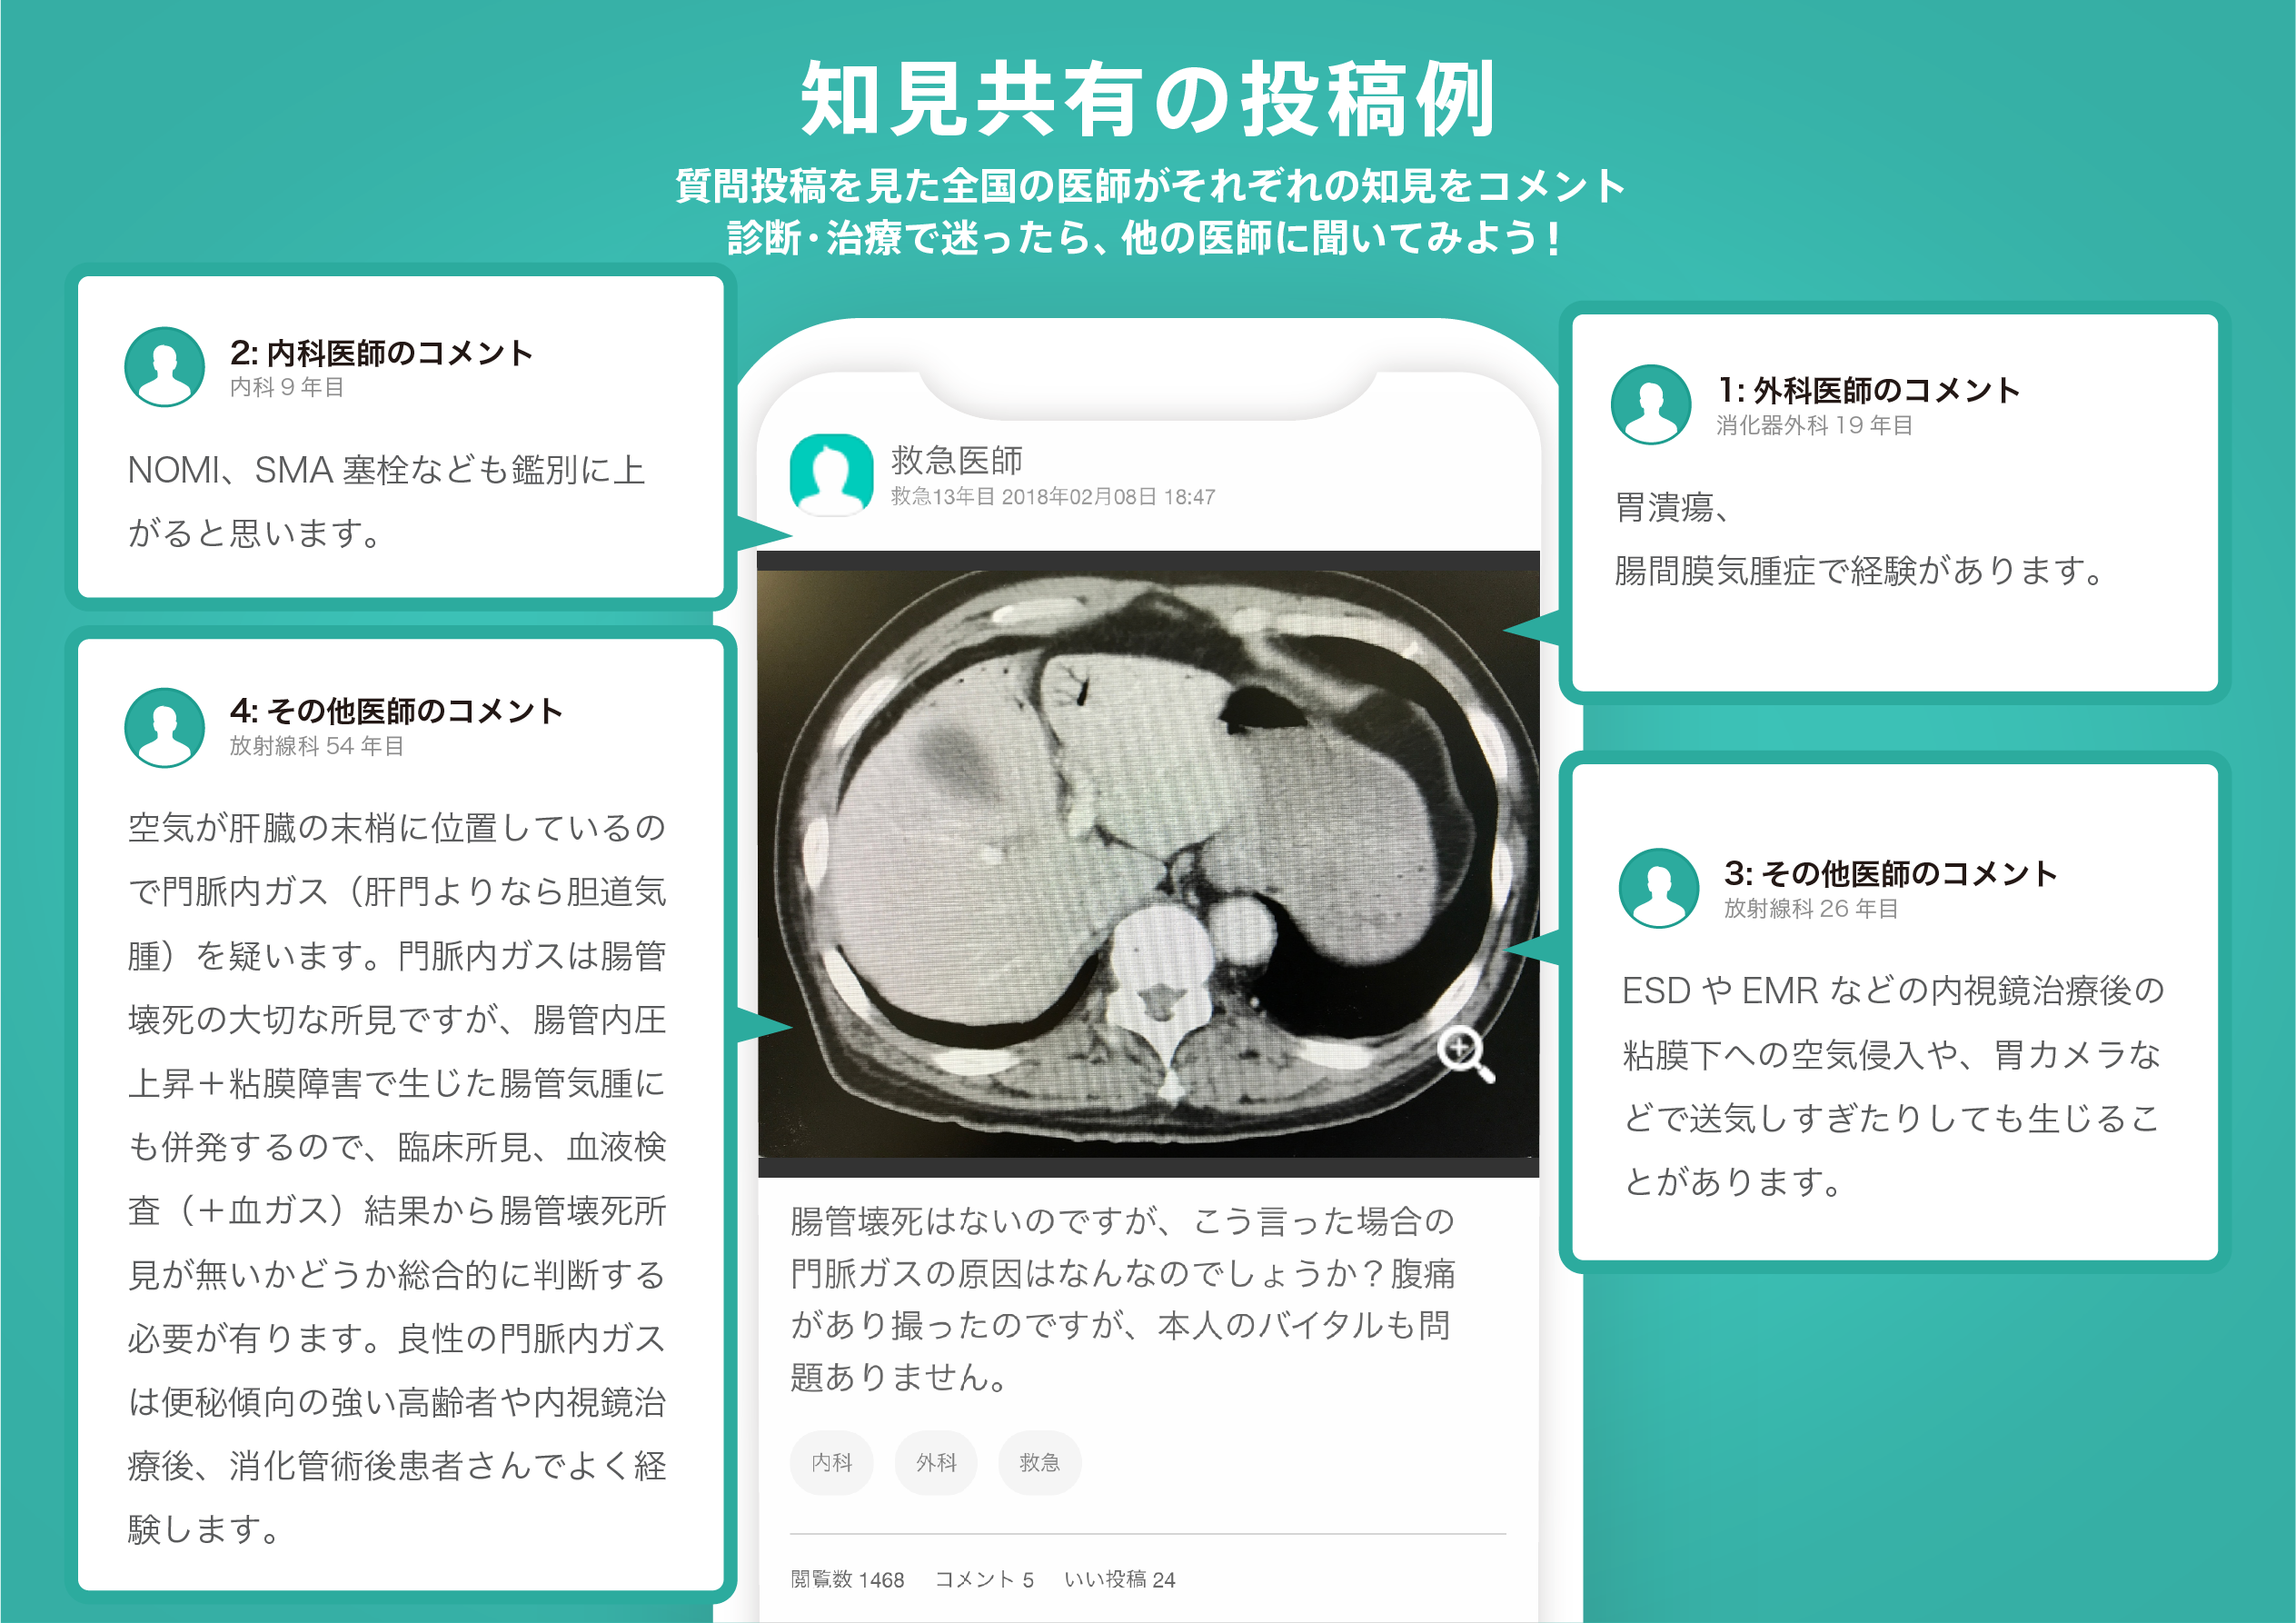
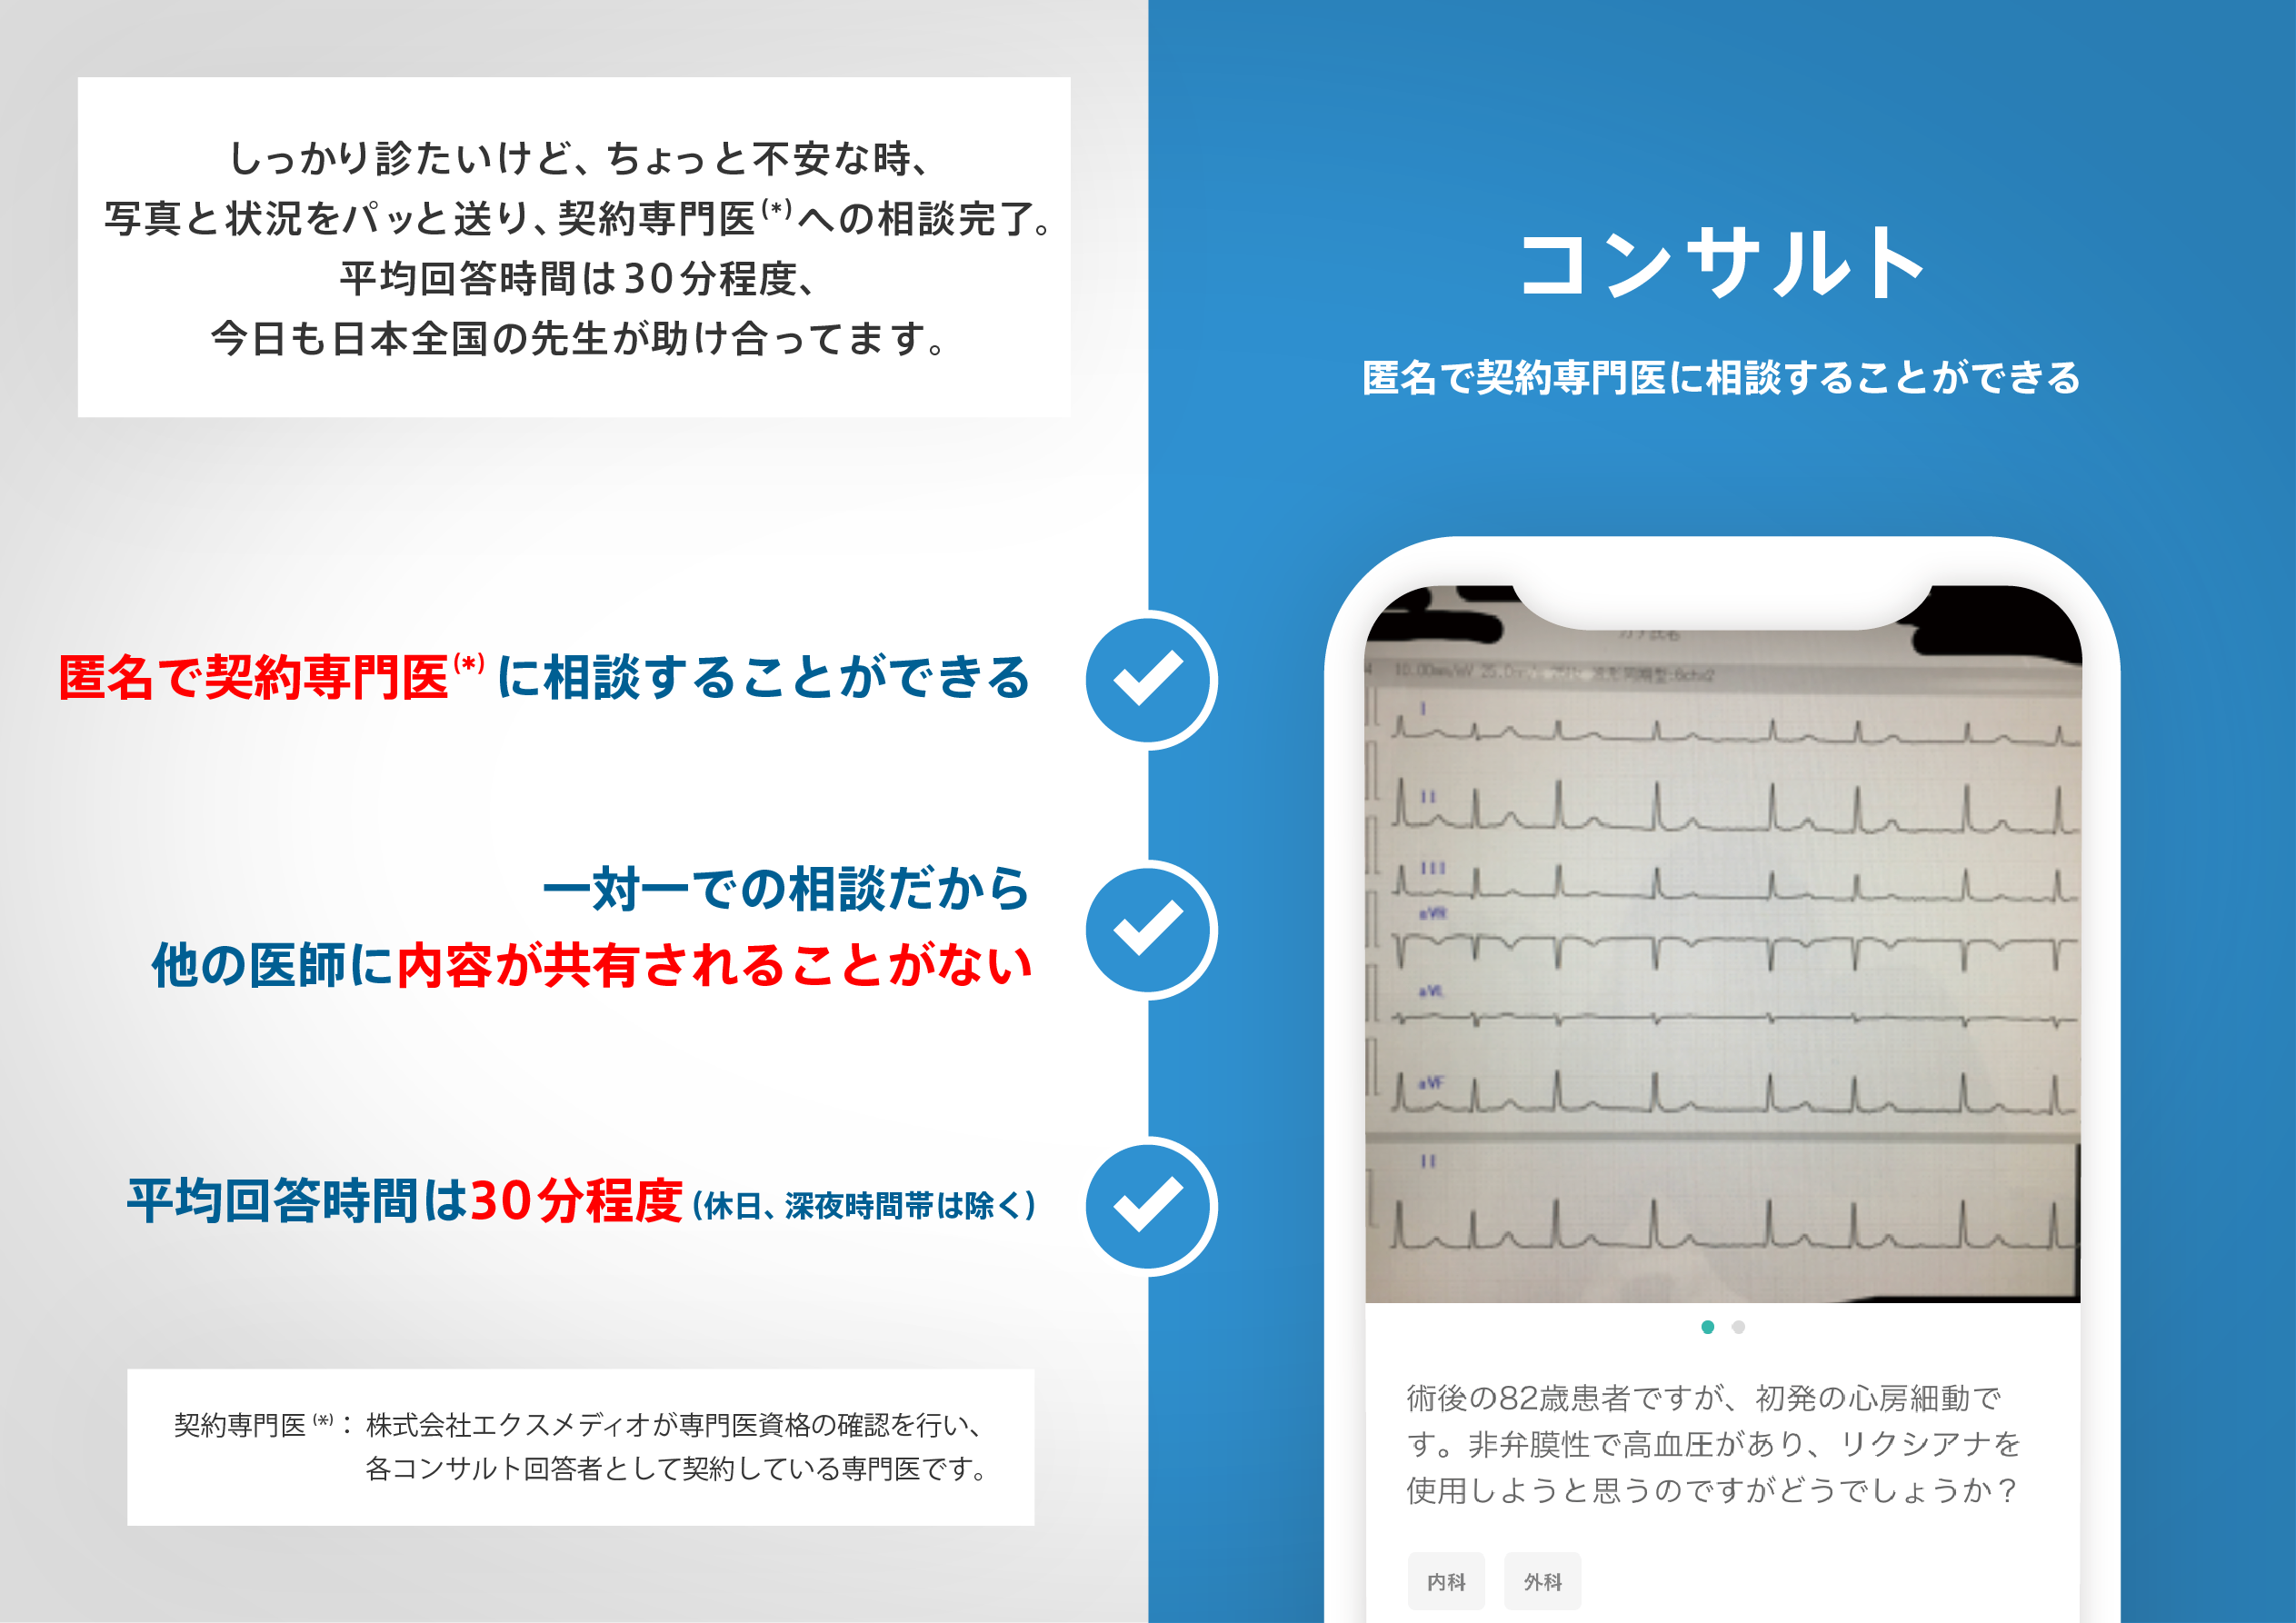
ヒポクラ x マイナビのご紹介
無料会員登録していただくと、さらに便利で効率的な検索が可能になります。

