著名医師による解説が無料で読めます
すると翻訳の精度が向上します
体積コンピューター断層撮影用量指数(CTDIVOL)は、モンテカルロ輸送技術と組み合わせた計算ヒトファントムから計算された臓器用量と組み合わせた患者の臓器用量を再構築するための重要な用量記述子です。CTDIVOLは、チューブ現在の時間産物(MGY/100 MAS)に正規化された重み付きCTDI(CTDIW)から導出できます。ボディ)、およびピッチ。正規化されたCTDIWは、CTスキャナーの特性の1つですが、文献から容易に入手できません。現在の研究では、複数のデータソースに基づいて正規化されたCTDIW値の包括的なデータベースを確立しました:英国からの影響線量調査、CT-EXPO用量計算プログラム、および米国食品医薬品局(FDA)が実施した調査国立肺スクリーニング試験(NLST)。ソースから、合計68、138、30、および13のスキャナーモデルグループのCTDIW値がそれぞれ収集されました。4つのデータソースからの異なるスキャナーグループがソートされ、162のスキャナーグループに統合され、General Electric(GE)、Siemens、Philips、Toshiba、Elscint、Picker、Shimadzu、Hitachiなどの8つのメーカーが含まれていました。不足しているCTDI値を入力するために、既存のデータに基づいて指数回帰分析に基づく方法が開発されました。データベースが完了すると、データの変動性の2つの異なる分析が実行されました。まず、さまざまなデータソースの各スキャナーのCTDI値を平均し、特定のメーカー内の異なるスキャナーモデル全体で平均CTDI値の変動性を分析しました。4つの主要メーカーのうち、東芝とフィリップスは、それぞれ39%と54%の頭と体の正規化されたCTDIW値に対して、最大の変動係数(COV)(=標準偏差/平均)を示しました。第二に、3つ以上のデータソースが関与するCTスキャナーについて、異なるデータソース全体の変動を分析しました。SiemensのスキャナーのCTDI値は、データソース全体で最大の変動を示し、東芝スキャナーのバリエーションの約4倍です。確立されたCTDIデータベースは、CTDivolの再構築に使用され、疫学研究における遡及的患者コホートの個別臓器用量の推定に使用されます。
体積コンピューター断層撮影用量指数(CTDIVOL)は、モンテカルロ輸送技術と組み合わせた計算ヒトファントムから計算された臓器用量と組み合わせた患者の臓器用量を再構築するための重要な用量記述子です。CTDIVOLは、チューブ現在の時間産物(MGY/100 MAS)に正規化された重み付きCTDI(CTDIW)から導出できます。ボディ)、およびピッチ。正規化されたCTDIWは、CTスキャナーの特性の1つですが、文献から容易に入手できません。現在の研究では、複数のデータソースに基づいて正規化されたCTDIW値の包括的なデータベースを確立しました:英国からの影響線量調査、CT-EXPO用量計算プログラム、および米国食品医薬品局(FDA)が実施した調査国立肺スクリーニング試験(NLST)。ソースから、合計68、138、30、および13のスキャナーモデルグループのCTDIW値がそれぞれ収集されました。4つのデータソースからの異なるスキャナーグループがソートされ、162のスキャナーグループに統合され、General Electric(GE)、Siemens、Philips、Toshiba、Elscint、Picker、Shimadzu、Hitachiなどの8つのメーカーが含まれていました。不足しているCTDI値を入力するために、既存のデータに基づいて指数回帰分析に基づく方法が開発されました。データベースが完了すると、データの変動性の2つの異なる分析が実行されました。まず、さまざまなデータソースの各スキャナーのCTDI値を平均し、特定のメーカー内の異なるスキャナーモデル全体で平均CTDI値の変動性を分析しました。4つの主要メーカーのうち、東芝とフィリップスは、それぞれ39%と54%の頭と体の正規化されたCTDIW値に対して、最大の変動係数(COV)(=標準偏差/平均)を示しました。第二に、3つ以上のデータソースが関与するCTスキャナーについて、異なるデータソース全体の変動を分析しました。SiemensのスキャナーのCTDI値は、データソース全体で最大の変動を示し、東芝スキャナーのバリエーションの約4倍です。確立されたCTDIデータベースは、CTDivolの再構築に使用され、疫学研究における遡及的患者コホートの個別臓器用量の推定に使用されます。
Volumetric computed tomography dose index (CTDIvol) is an important dose descriptor to reconstruct organ doses for patients combined with the organ dose calculated from computational human phantoms coupled with Monte Carlo transport techniques. CTDIvol can be derived from weighted CTDI (CTDIw) normalised to the tube current-time product (mGy/100 mAs), using knowledge of tube current-time product (mAs), tube potential (kVp), type of CTDI phantoms (head or body), and pitch. The normalised CTDIw is one of the characteristics of a CT scanner but not readily available from the literature. In the current study, we established a comprehensive database of normalised CTDIw values based on multiple data sources: the ImPACT dose survey from the United Kingdom, the CT-Expo dose calculation program, and surveys performed by the US Food and Drug Administration (FDA) and the National Lung Screening Trial (NLST). From the sources, the CTDIw values for a total of 68, 138, 30, and 13 scanner model groups were collected, respectively. The different scanner groups from the four data sources were sorted and merged into 162 scanner groups for eight manufacturers including General Electric (GE), Siemens, Philips, Toshiba, Elscint, Picker, Shimadzu, and Hitachi. To fill in missing CTDI values, a method based on exponential regression analysis was developed based on the existing data. Once the database was completed, two different analyses of data variability were performed. First, we averaged CTDI values for each scanner in the different data sources and analysed the variability of the average CTDI values across the different scanner models within a given manufacturer. Among the four major manufacturers, Toshiba and Philips showed the greatest coefficient of variation (COV) (=standard deviation/mean) for the head and body normalised CTDIw values, 39% and 54%, respectively. Second, the variation across the different data sources was analysed for CT scanners where more than two data sources were involved. The CTDI values for the scanners from Siemens showed the greatest variation across the data sources, being about four times greater than the variation of Toshiba scanners. The established CTDI database will be used for the reconstruction of CTDIvol and then the estimation of individualised organ doses for retrospective patient cohorts in epidemiologic studies.
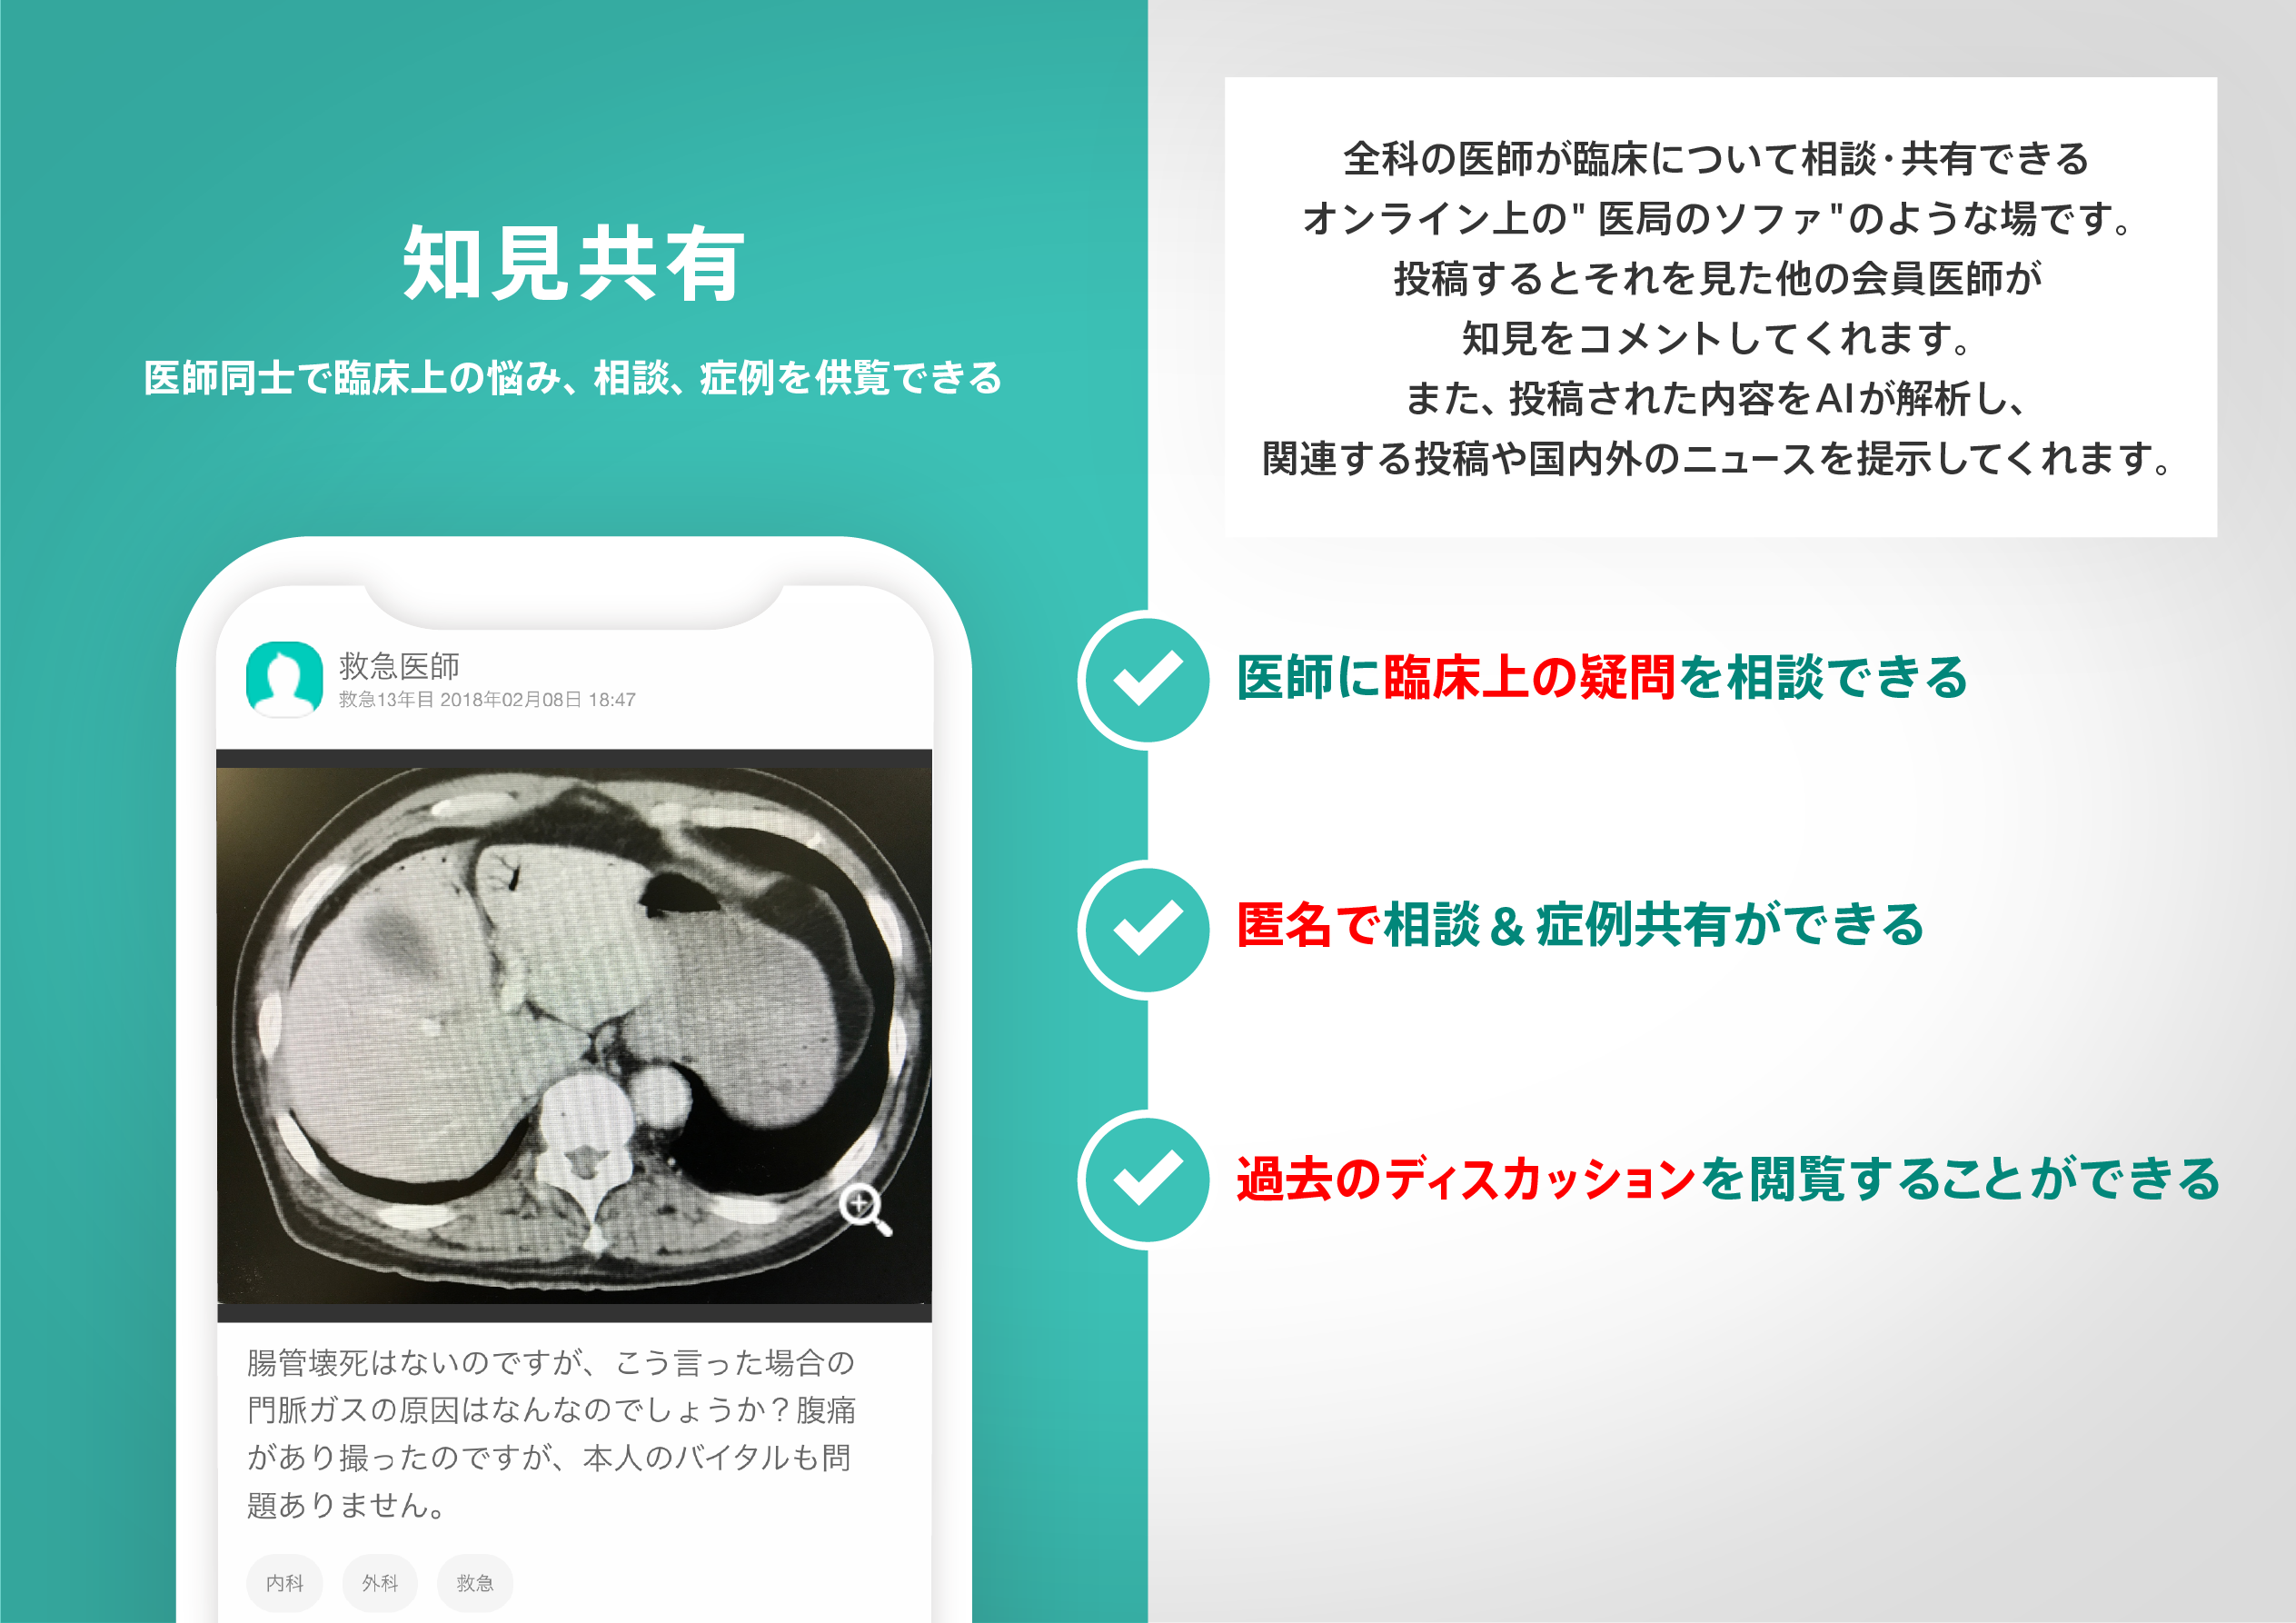
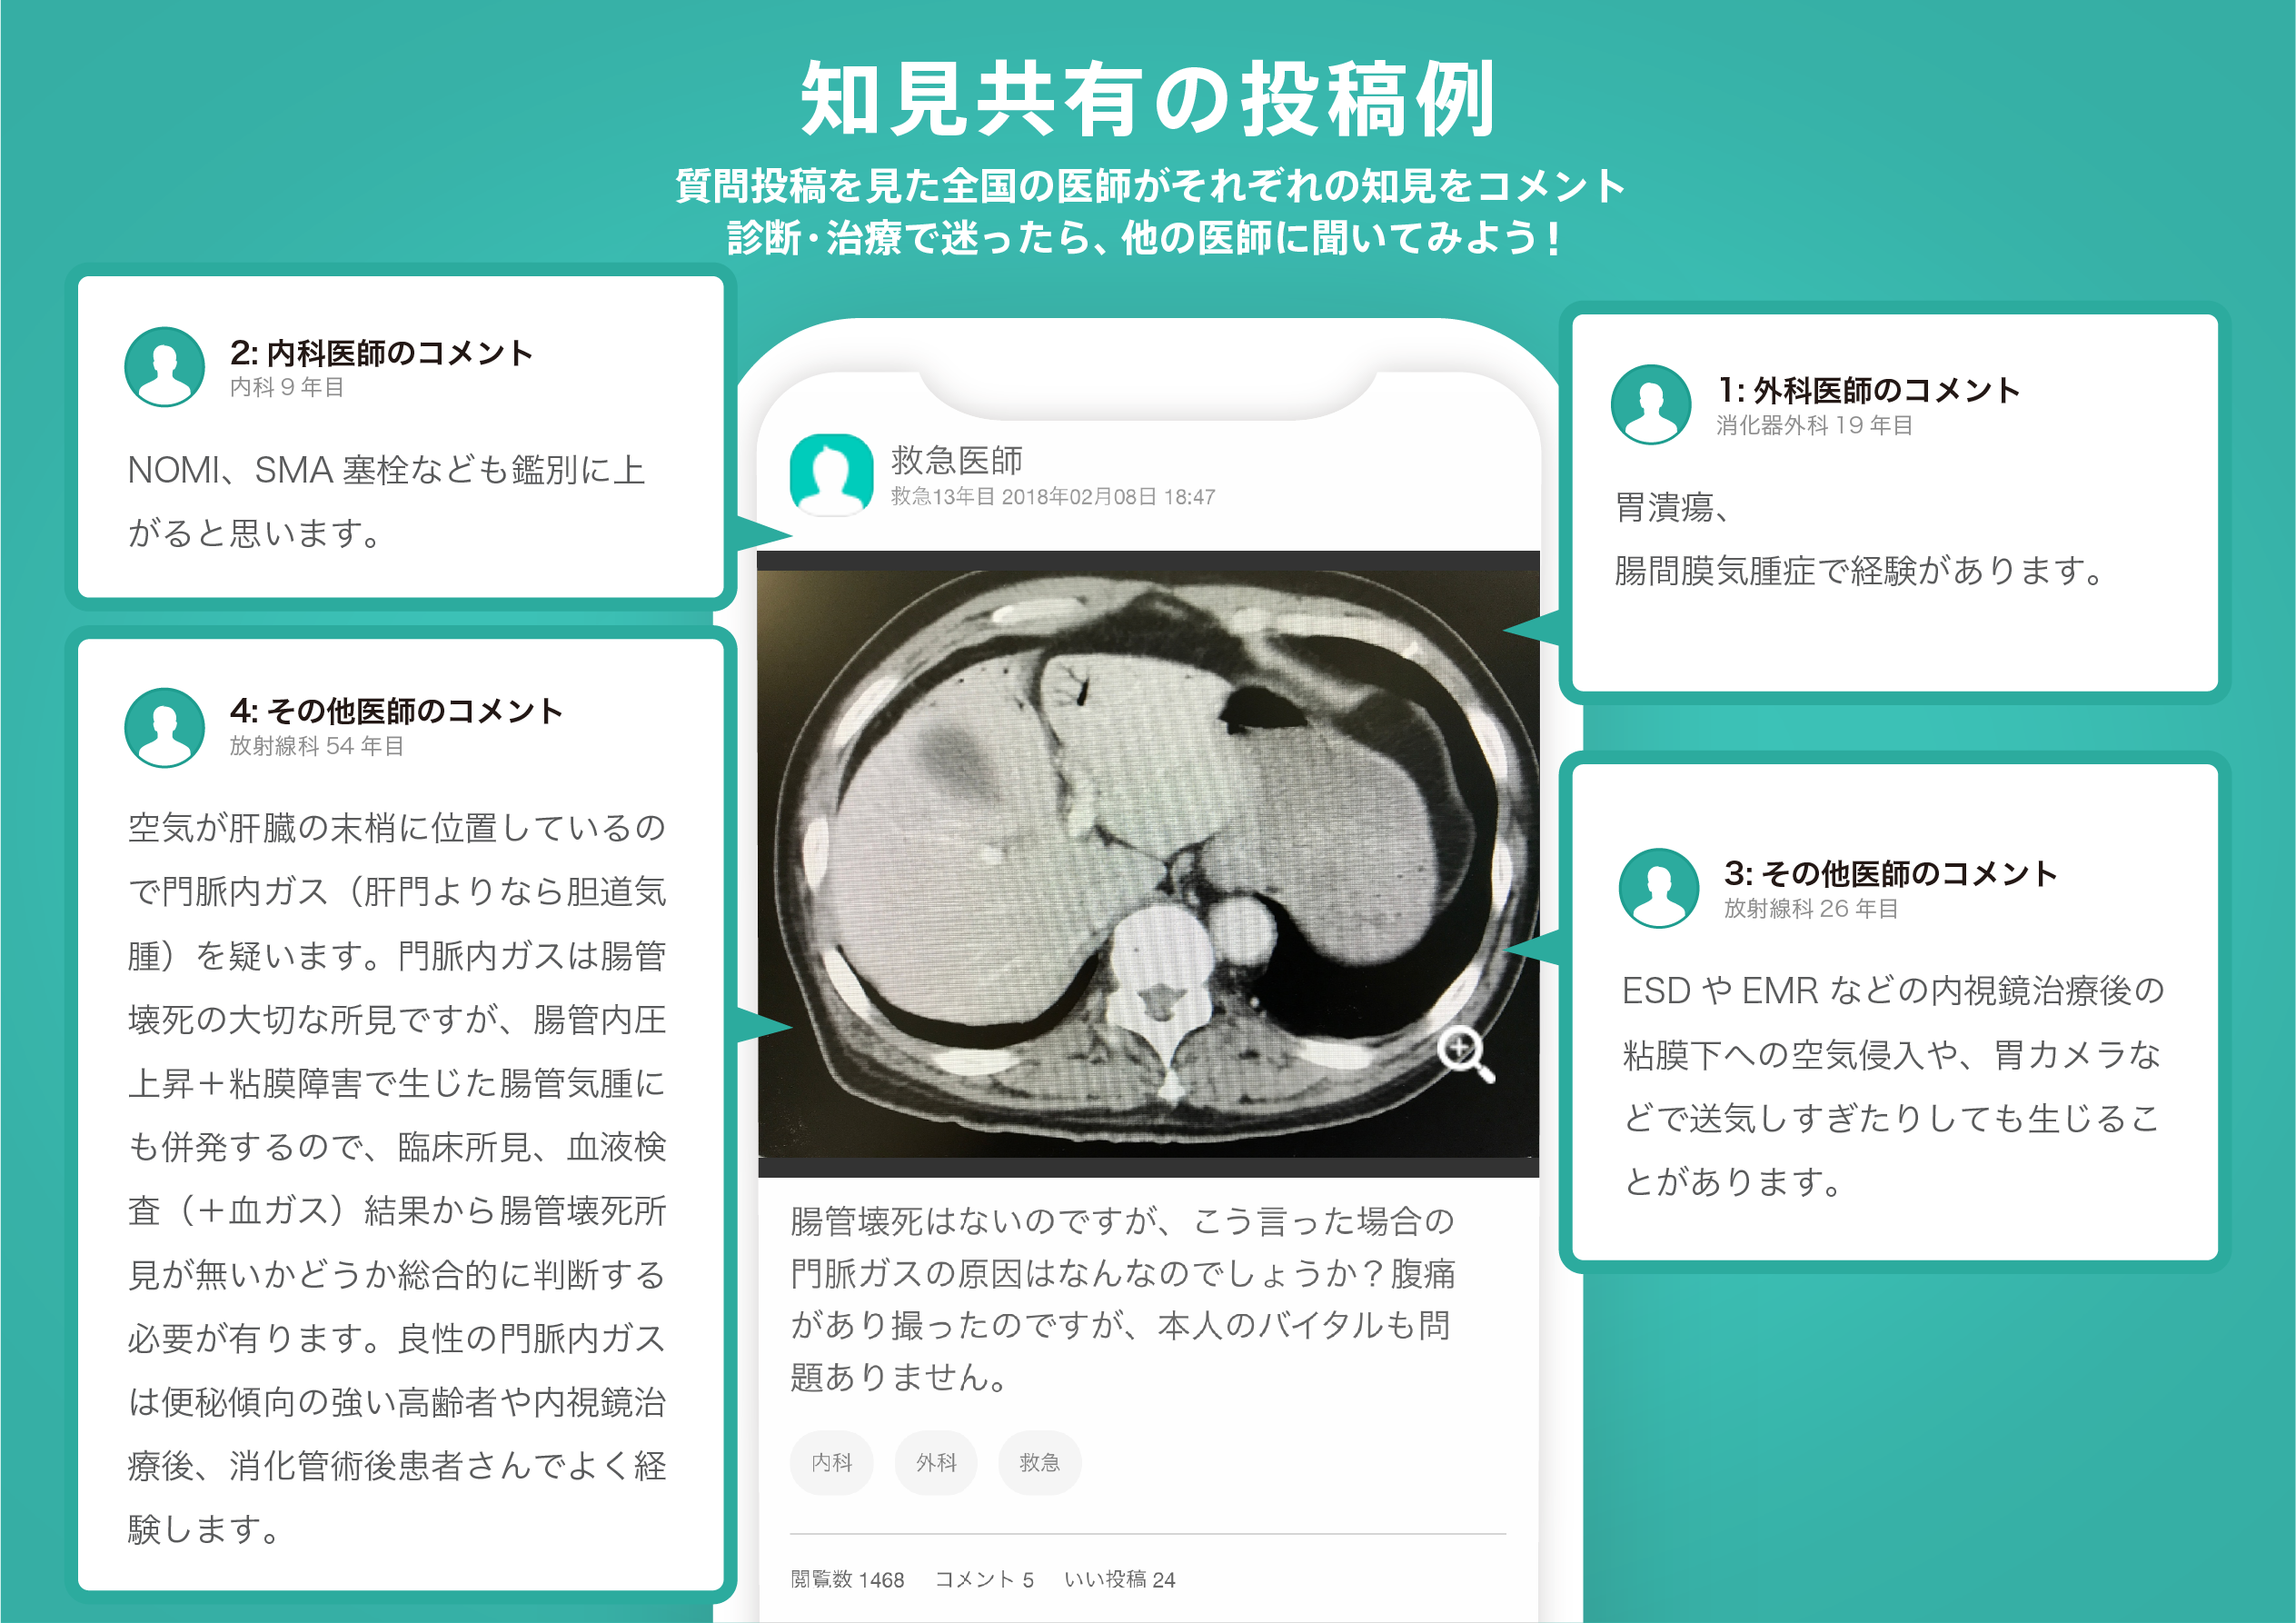
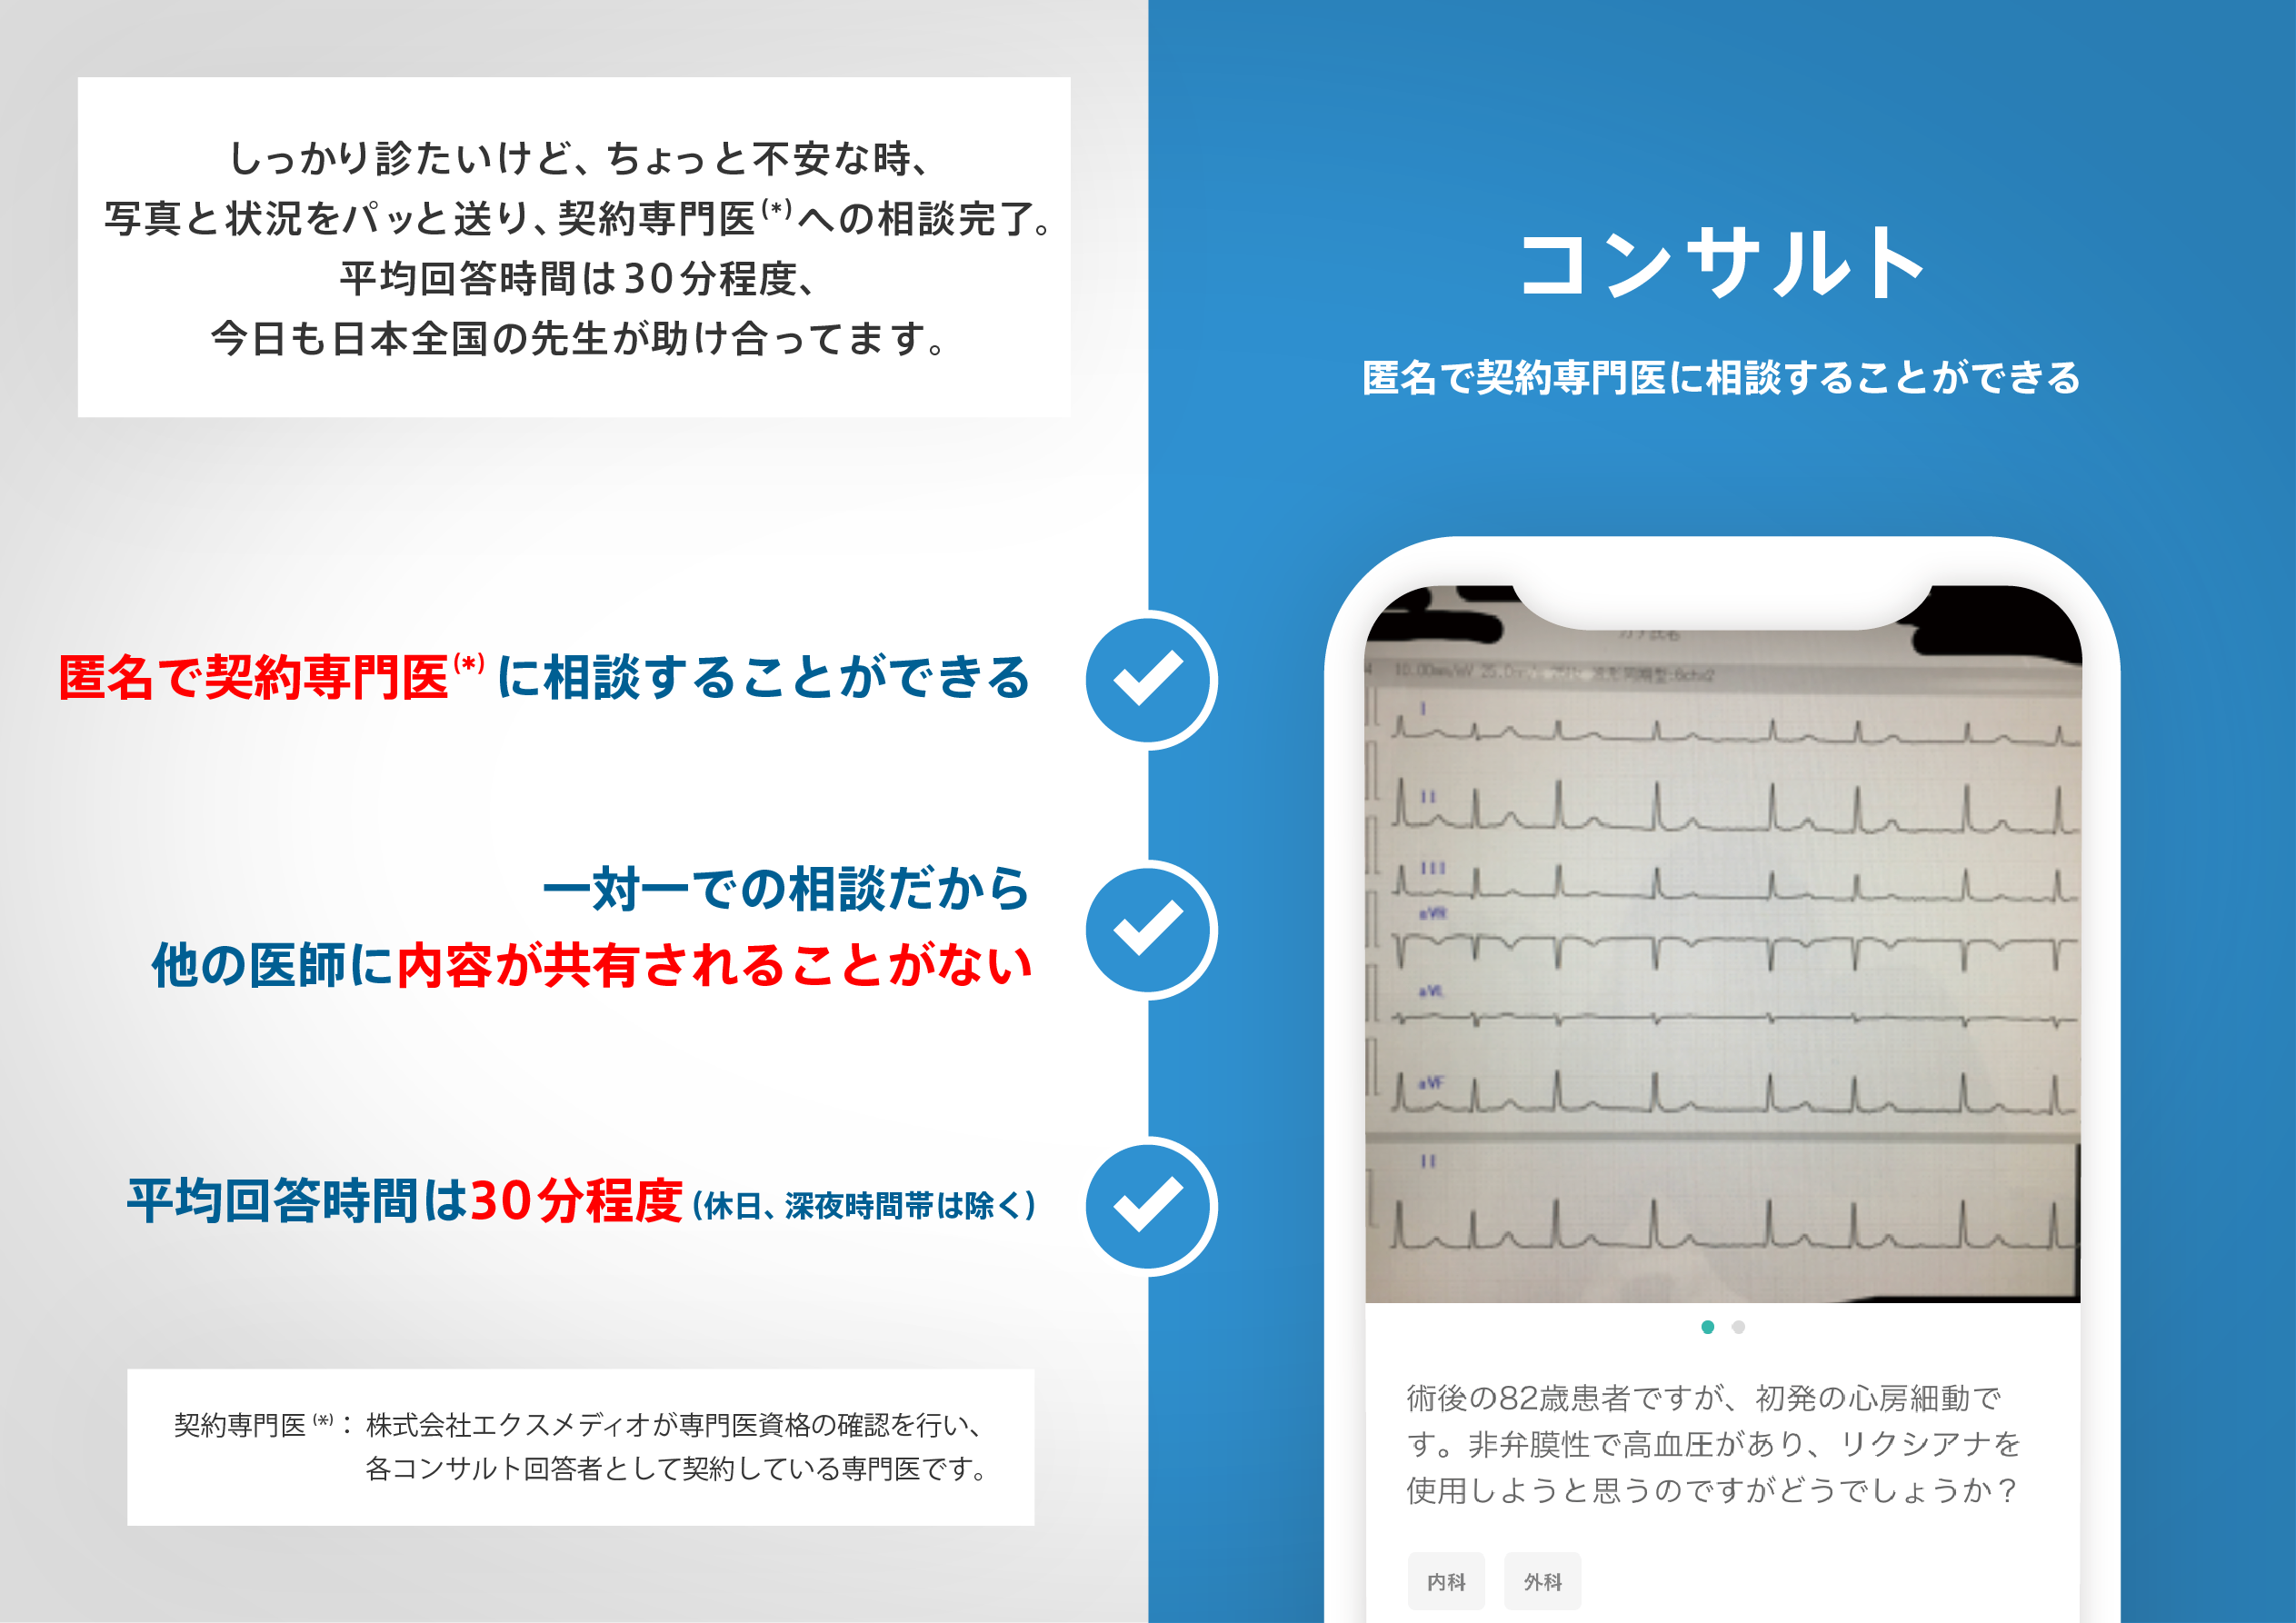
医師のための臨床サポートサービス
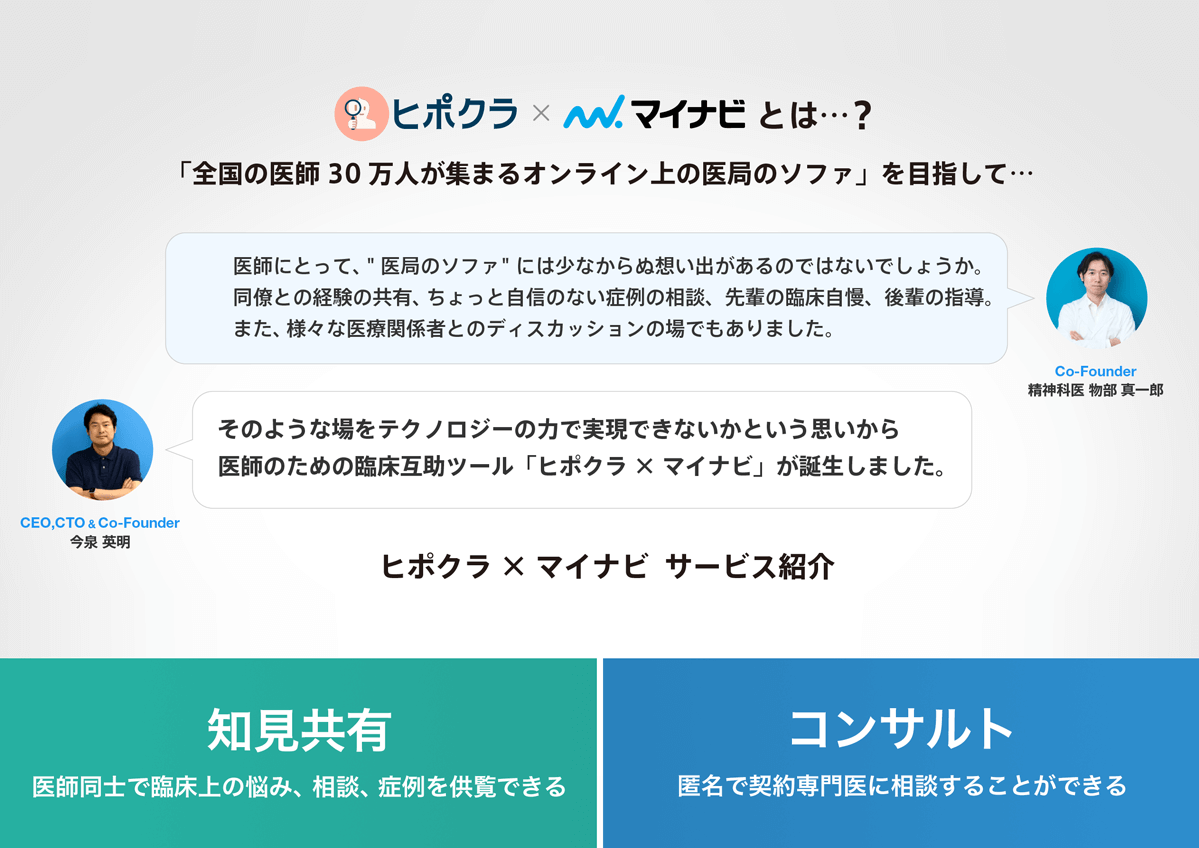
ヒポクラ x マイナビのご紹介
無料会員登録していただくと、さらに便利で効率的な検索が可能になります。

