著名医師による解説が無料で読めます
すると翻訳の精度が向上します
本研究は、2つの欧州連合(EU)の食事調査を使用して、栄養標識目的で食品ポーションサイズを開発するオプションを調査することを目的としています。The surveys were selected as they differed in (a) methodologies (food diary versus food frequency questionnaire), (b) populations (Irish National Adult Nutrition Survey (NANS) versus a seven-country survey based on the pan EU study Food4Me), (c) food quantification (multiple options versus solely photographic album) and (d) duration (4 consecutive days versus recent month).これらの研究からのデータを使用して、15のテスト食品についてポーションサイズを決定しました。そこでは、消費されたときにターゲット食品の摂取量の中央値としてポーションサイズが定義されました。NANSとFood4ME調査の両方から導出された部分サイズの中央値は相関しており(r = 0.823; p <0.00)、2つの調査データセットの平均は、慣習的に消費される(RACC)データベースとして認識されたUS値と比較されました。平均EUと米国のポーションサイズとの間のすべての食品カテゴリで非常に強力な一致がありました(r = 0.947; p <0.00)。EUの食事調査データに使用されるさまざまなアプローチにもかかわらず、現在のデータは、EUの食品標識の食品ポーションサイズの定量化に対する標準化されたアプローチを使用してサポートしていると結論付けられています。
本研究は、2つの欧州連合(EU)の食事調査を使用して、栄養標識目的で食品ポーションサイズを開発するオプションを調査することを目的としています。The surveys were selected as they differed in (a) methodologies (food diary versus food frequency questionnaire), (b) populations (Irish National Adult Nutrition Survey (NANS) versus a seven-country survey based on the pan EU study Food4Me), (c) food quantification (multiple options versus solely photographic album) and (d) duration (4 consecutive days versus recent month).これらの研究からのデータを使用して、15のテスト食品についてポーションサイズを決定しました。そこでは、消費されたときにターゲット食品の摂取量の中央値としてポーションサイズが定義されました。NANSとFood4ME調査の両方から導出された部分サイズの中央値は相関しており(r = 0.823; p <0.00)、2つの調査データセットの平均は、慣習的に消費される(RACC)データベースとして認識されたUS値と比較されました。平均EUと米国のポーションサイズとの間のすべての食品カテゴリで非常に強力な一致がありました(r = 0.947; p <0.00)。EUの食事調査データに使用されるさまざまなアプローチにもかかわらず、現在のデータは、EUの食品標識の食品ポーションサイズの定量化に対する標準化されたアプローチを使用してサポートしていると結論付けられています。
The present study set out to explore the option of developing food portion size for nutritional labelling purposes using two European Union (EU) dietary surveys. The surveys were selected as they differed in (a) methodologies (food diary versus food frequency questionnaire), (b) populations (Irish National Adult Nutrition Survey (NANS) versus a seven-country survey based on the pan EU study Food4Me), (c) food quantification (multiple options versus solely photographic album) and (d) duration (4 consecutive days versus recent month). Using data from these studies, portion size was determined for 15 test foods, where portion size was defined as the median intake of a target food when consumed. The median values of the portion sizes derived from both the NANS and Food4Me surveys were correlated (r = 0.823; p < 0.00) and the mean of the two survey data sets were compared to US values from the Recognized as Customarily Consumed (RACC) database. There was very strong agreement across all food categories between the averaged EU and the US portion size (r = 0.947; p < 0.00). It is concluded that notwithstanding the variety of approaches used for dietary survey data in the EU, the present data supports using a standardized approach to food portion size quantification for food labelling in the EU.
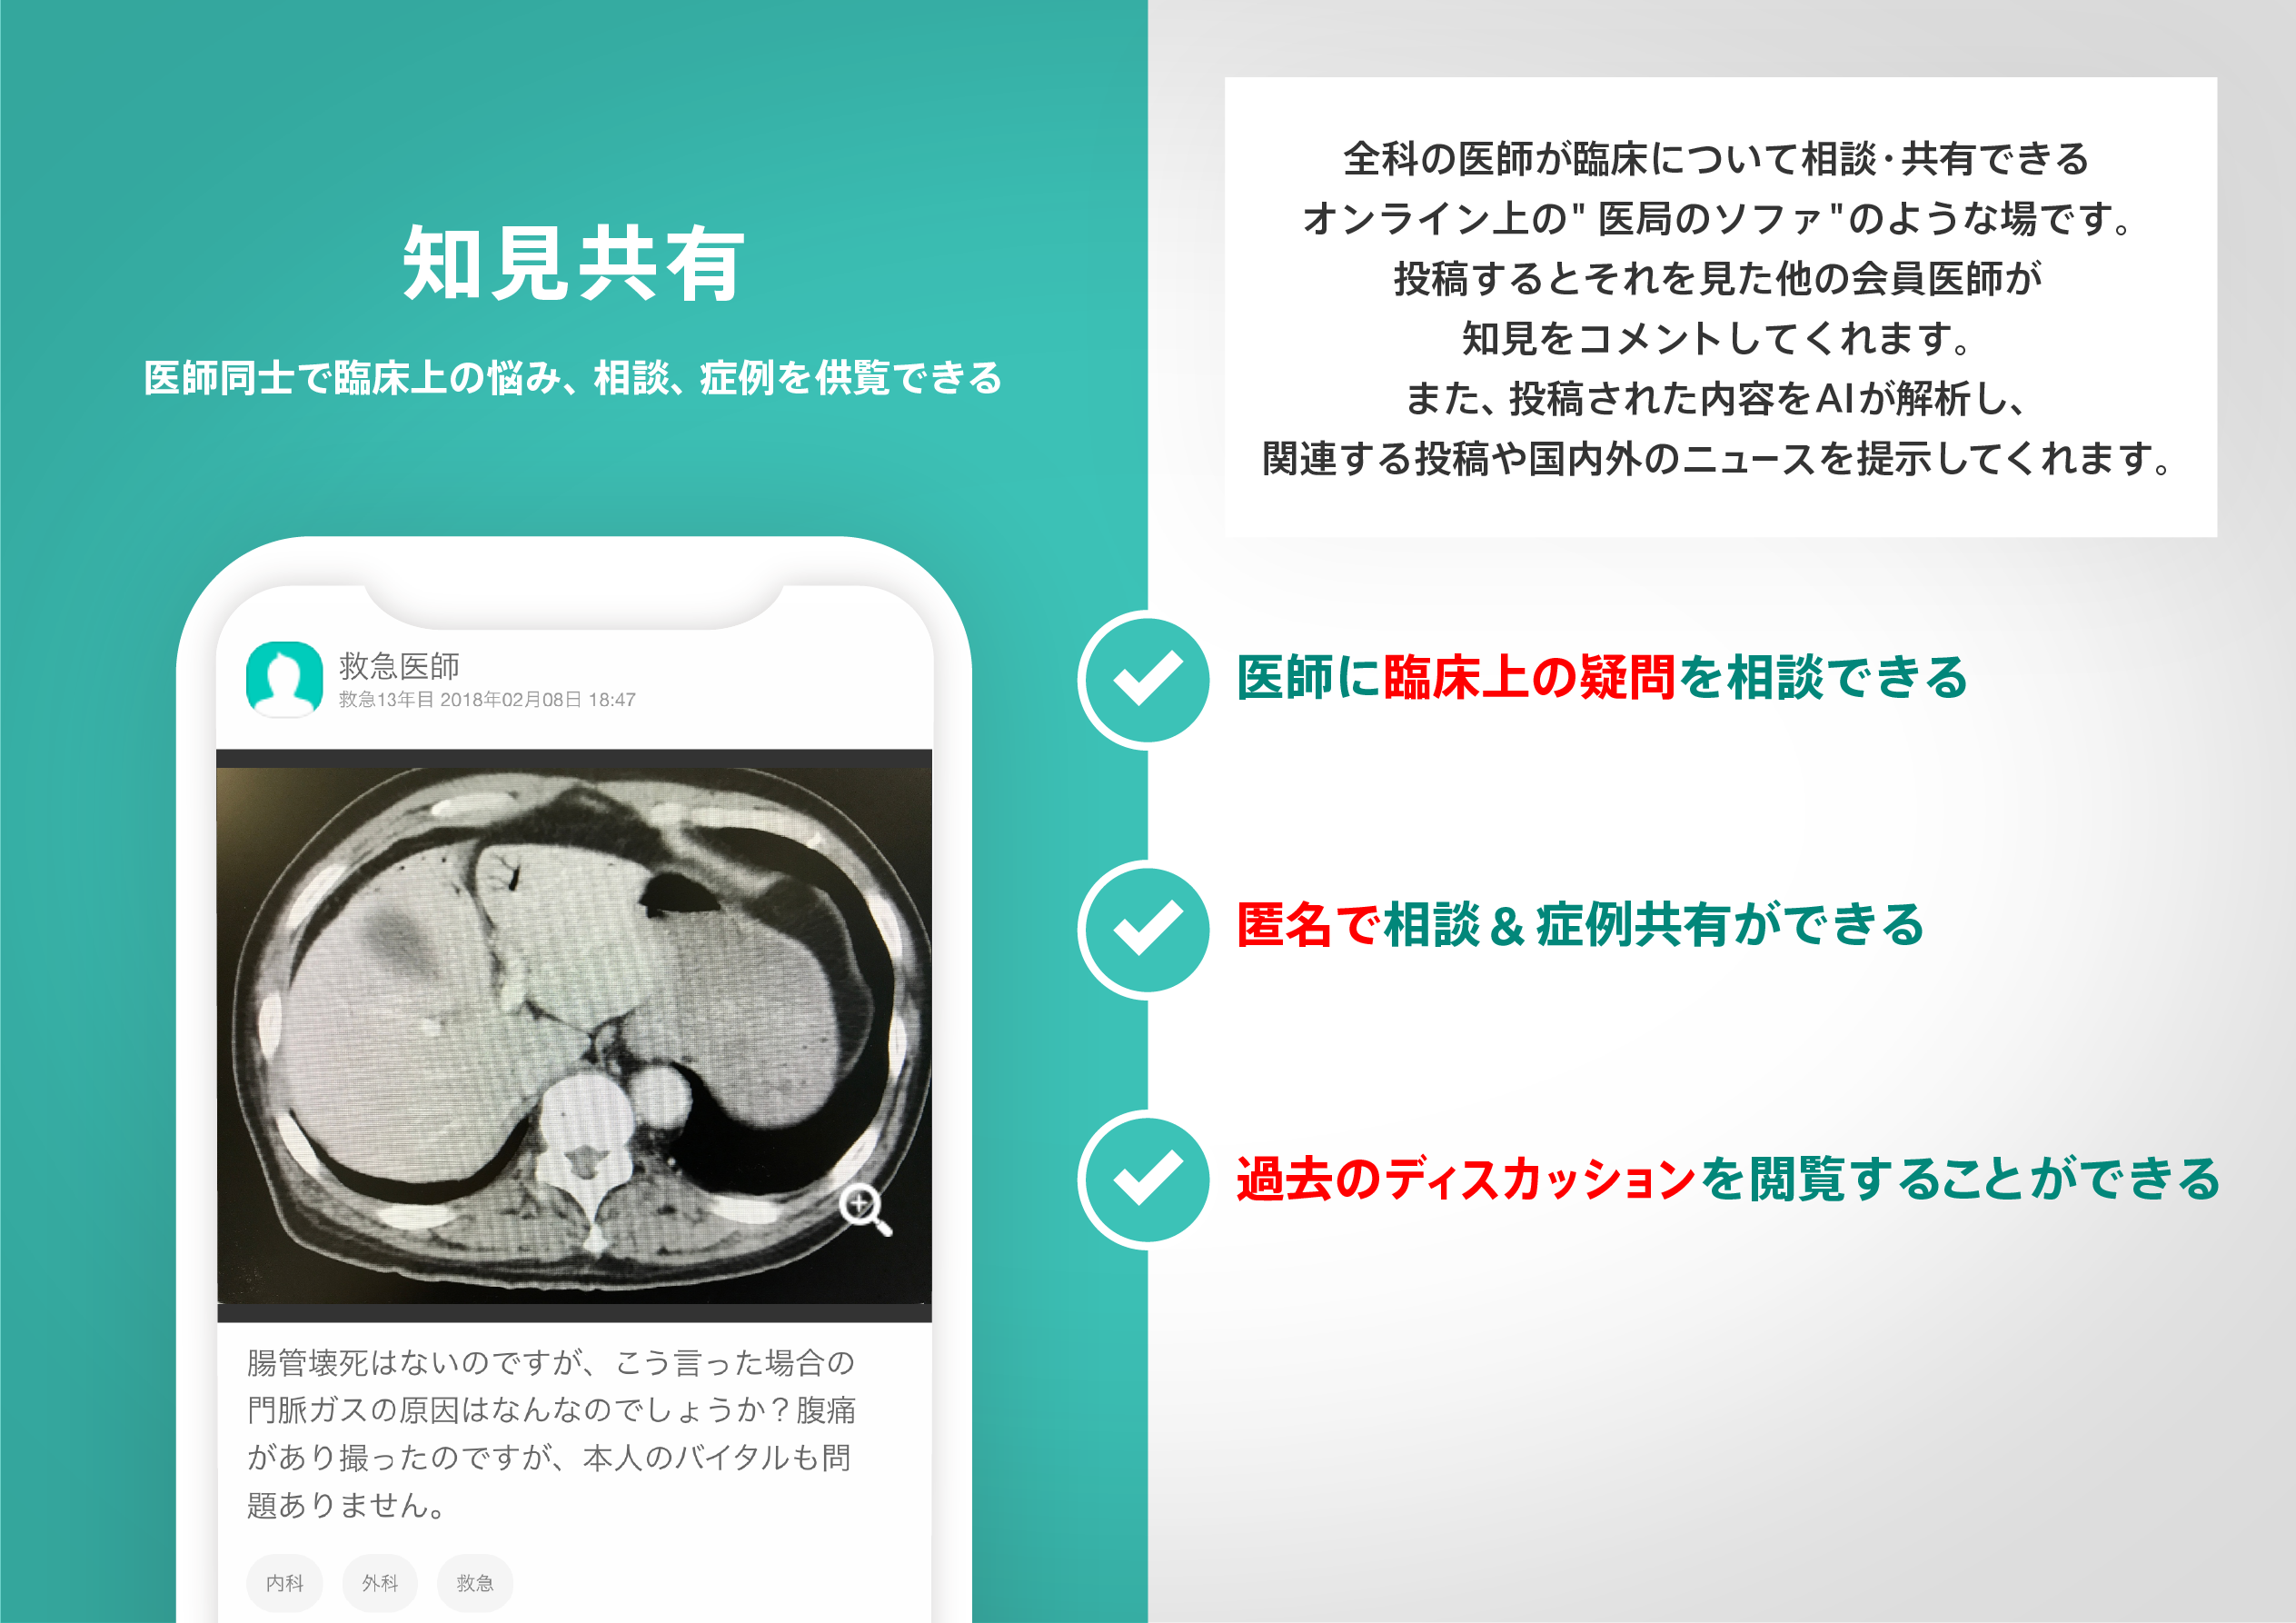
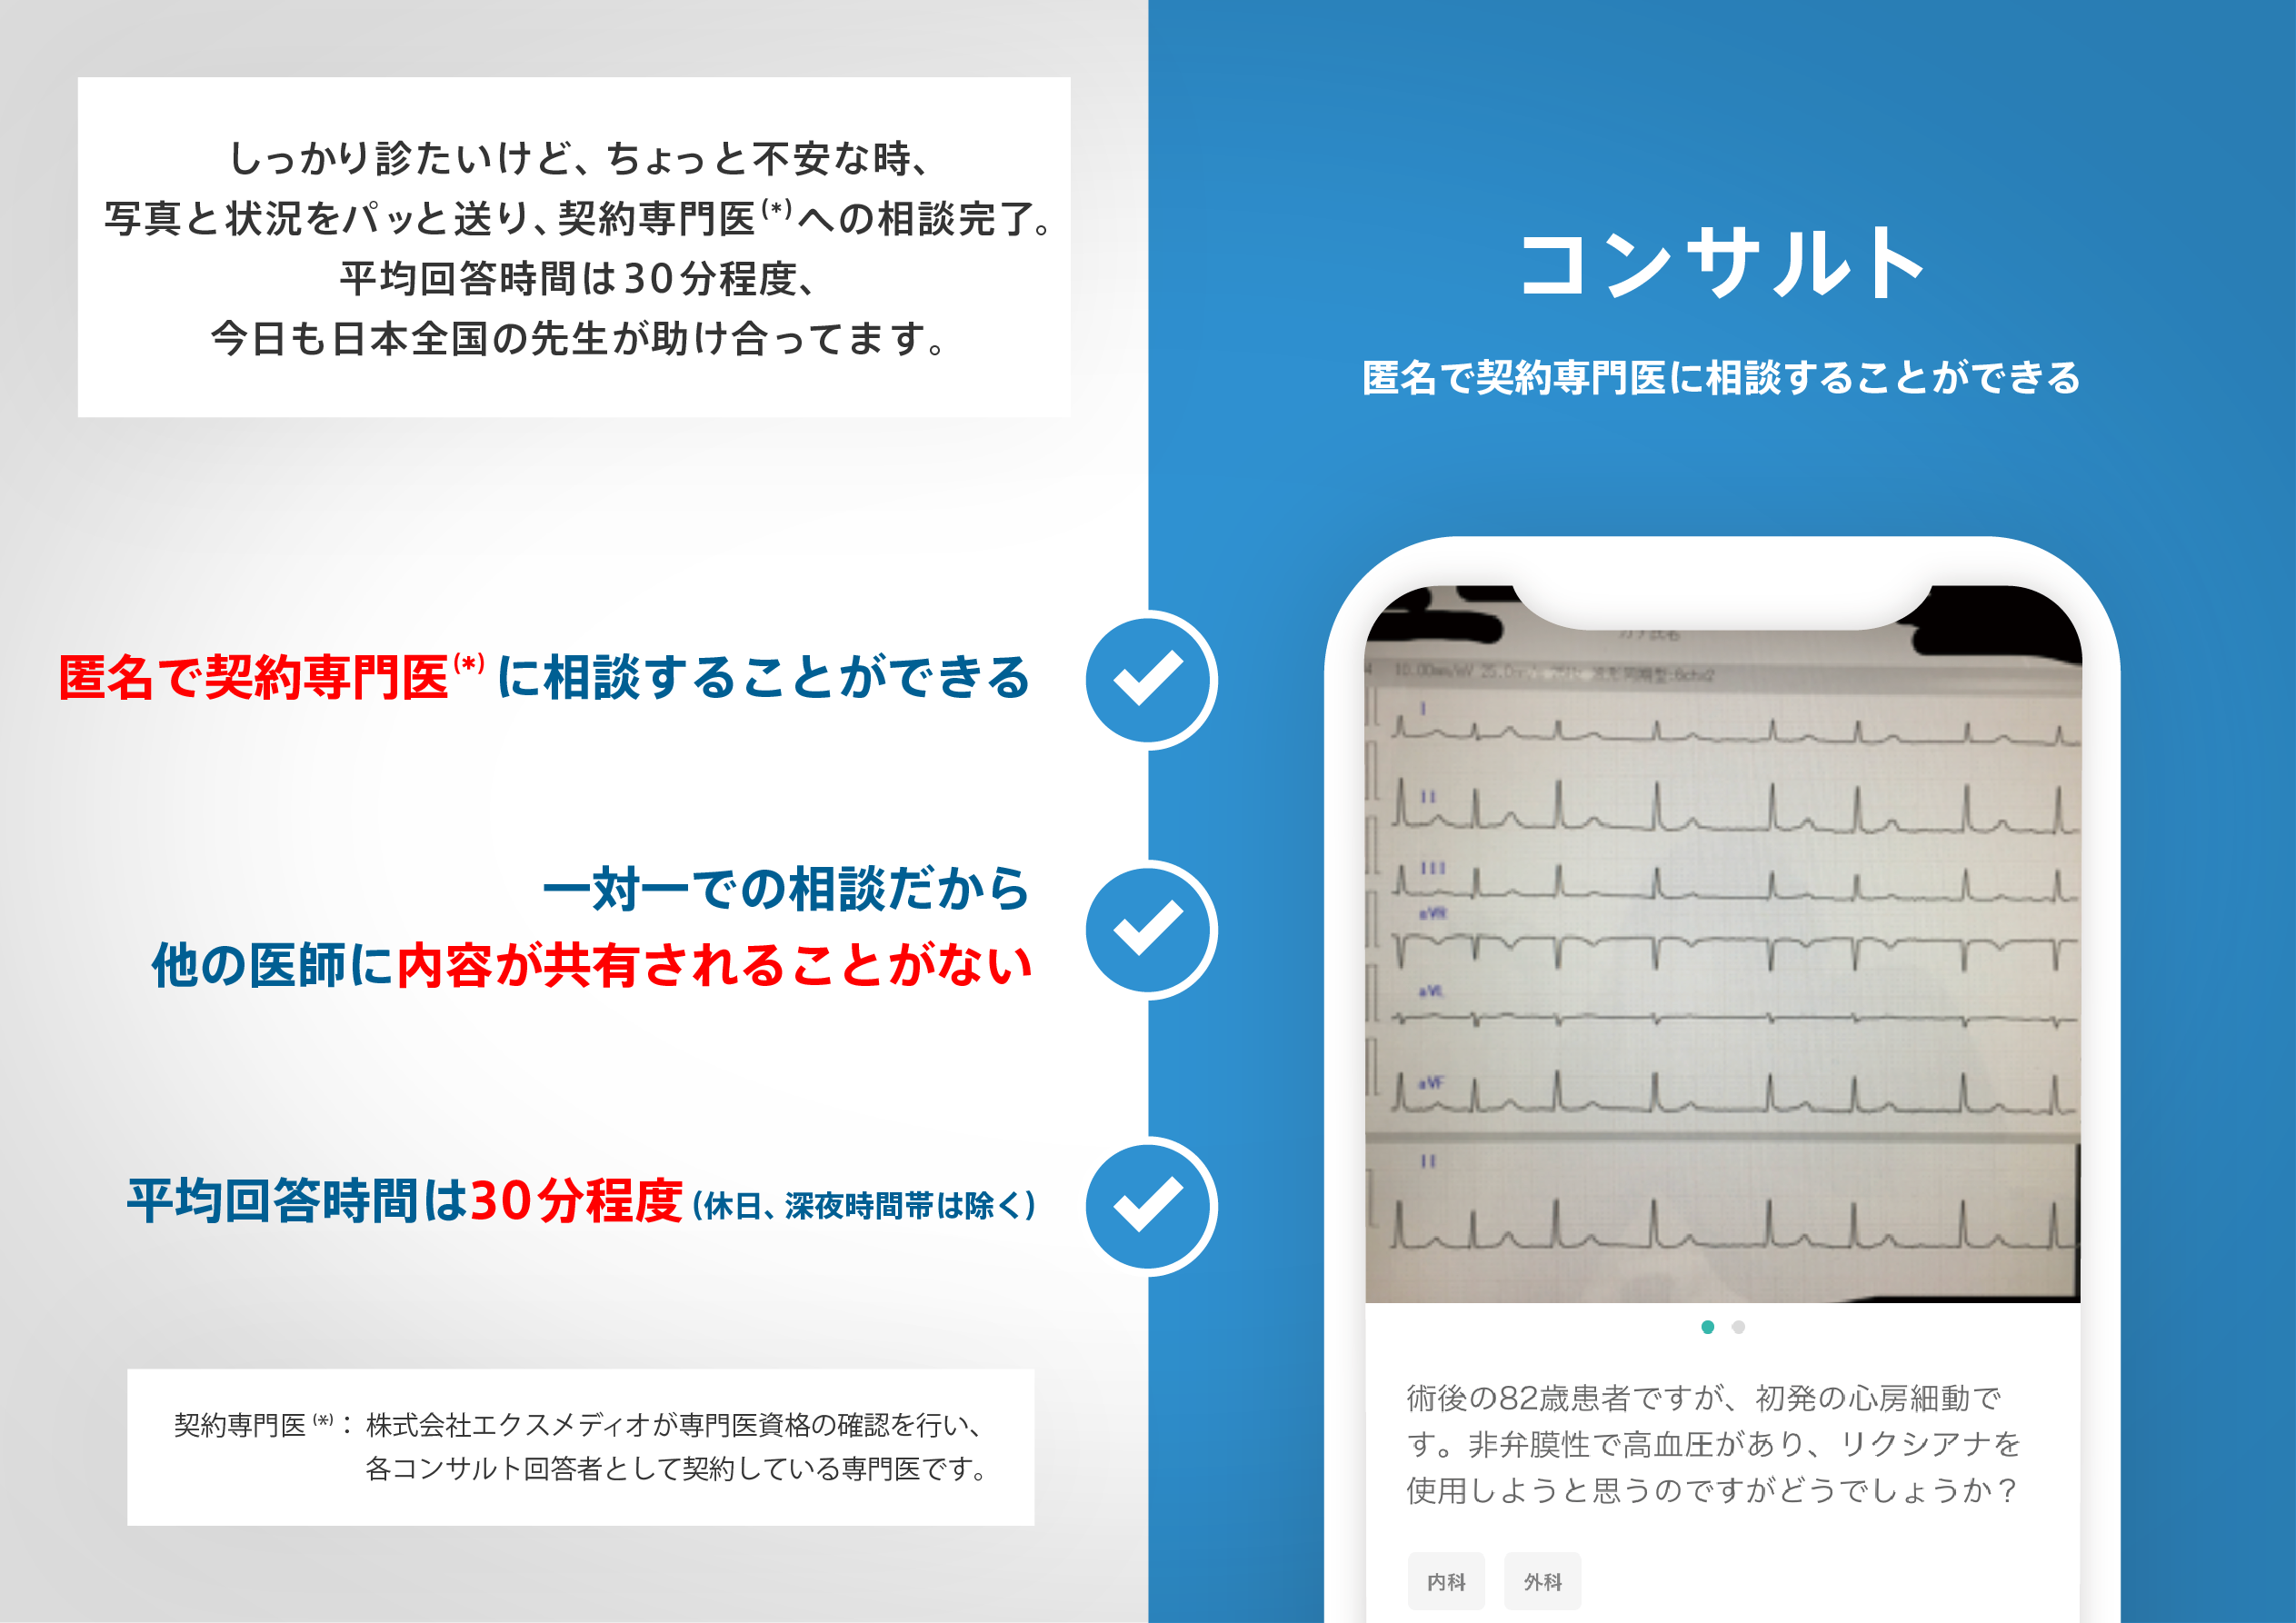
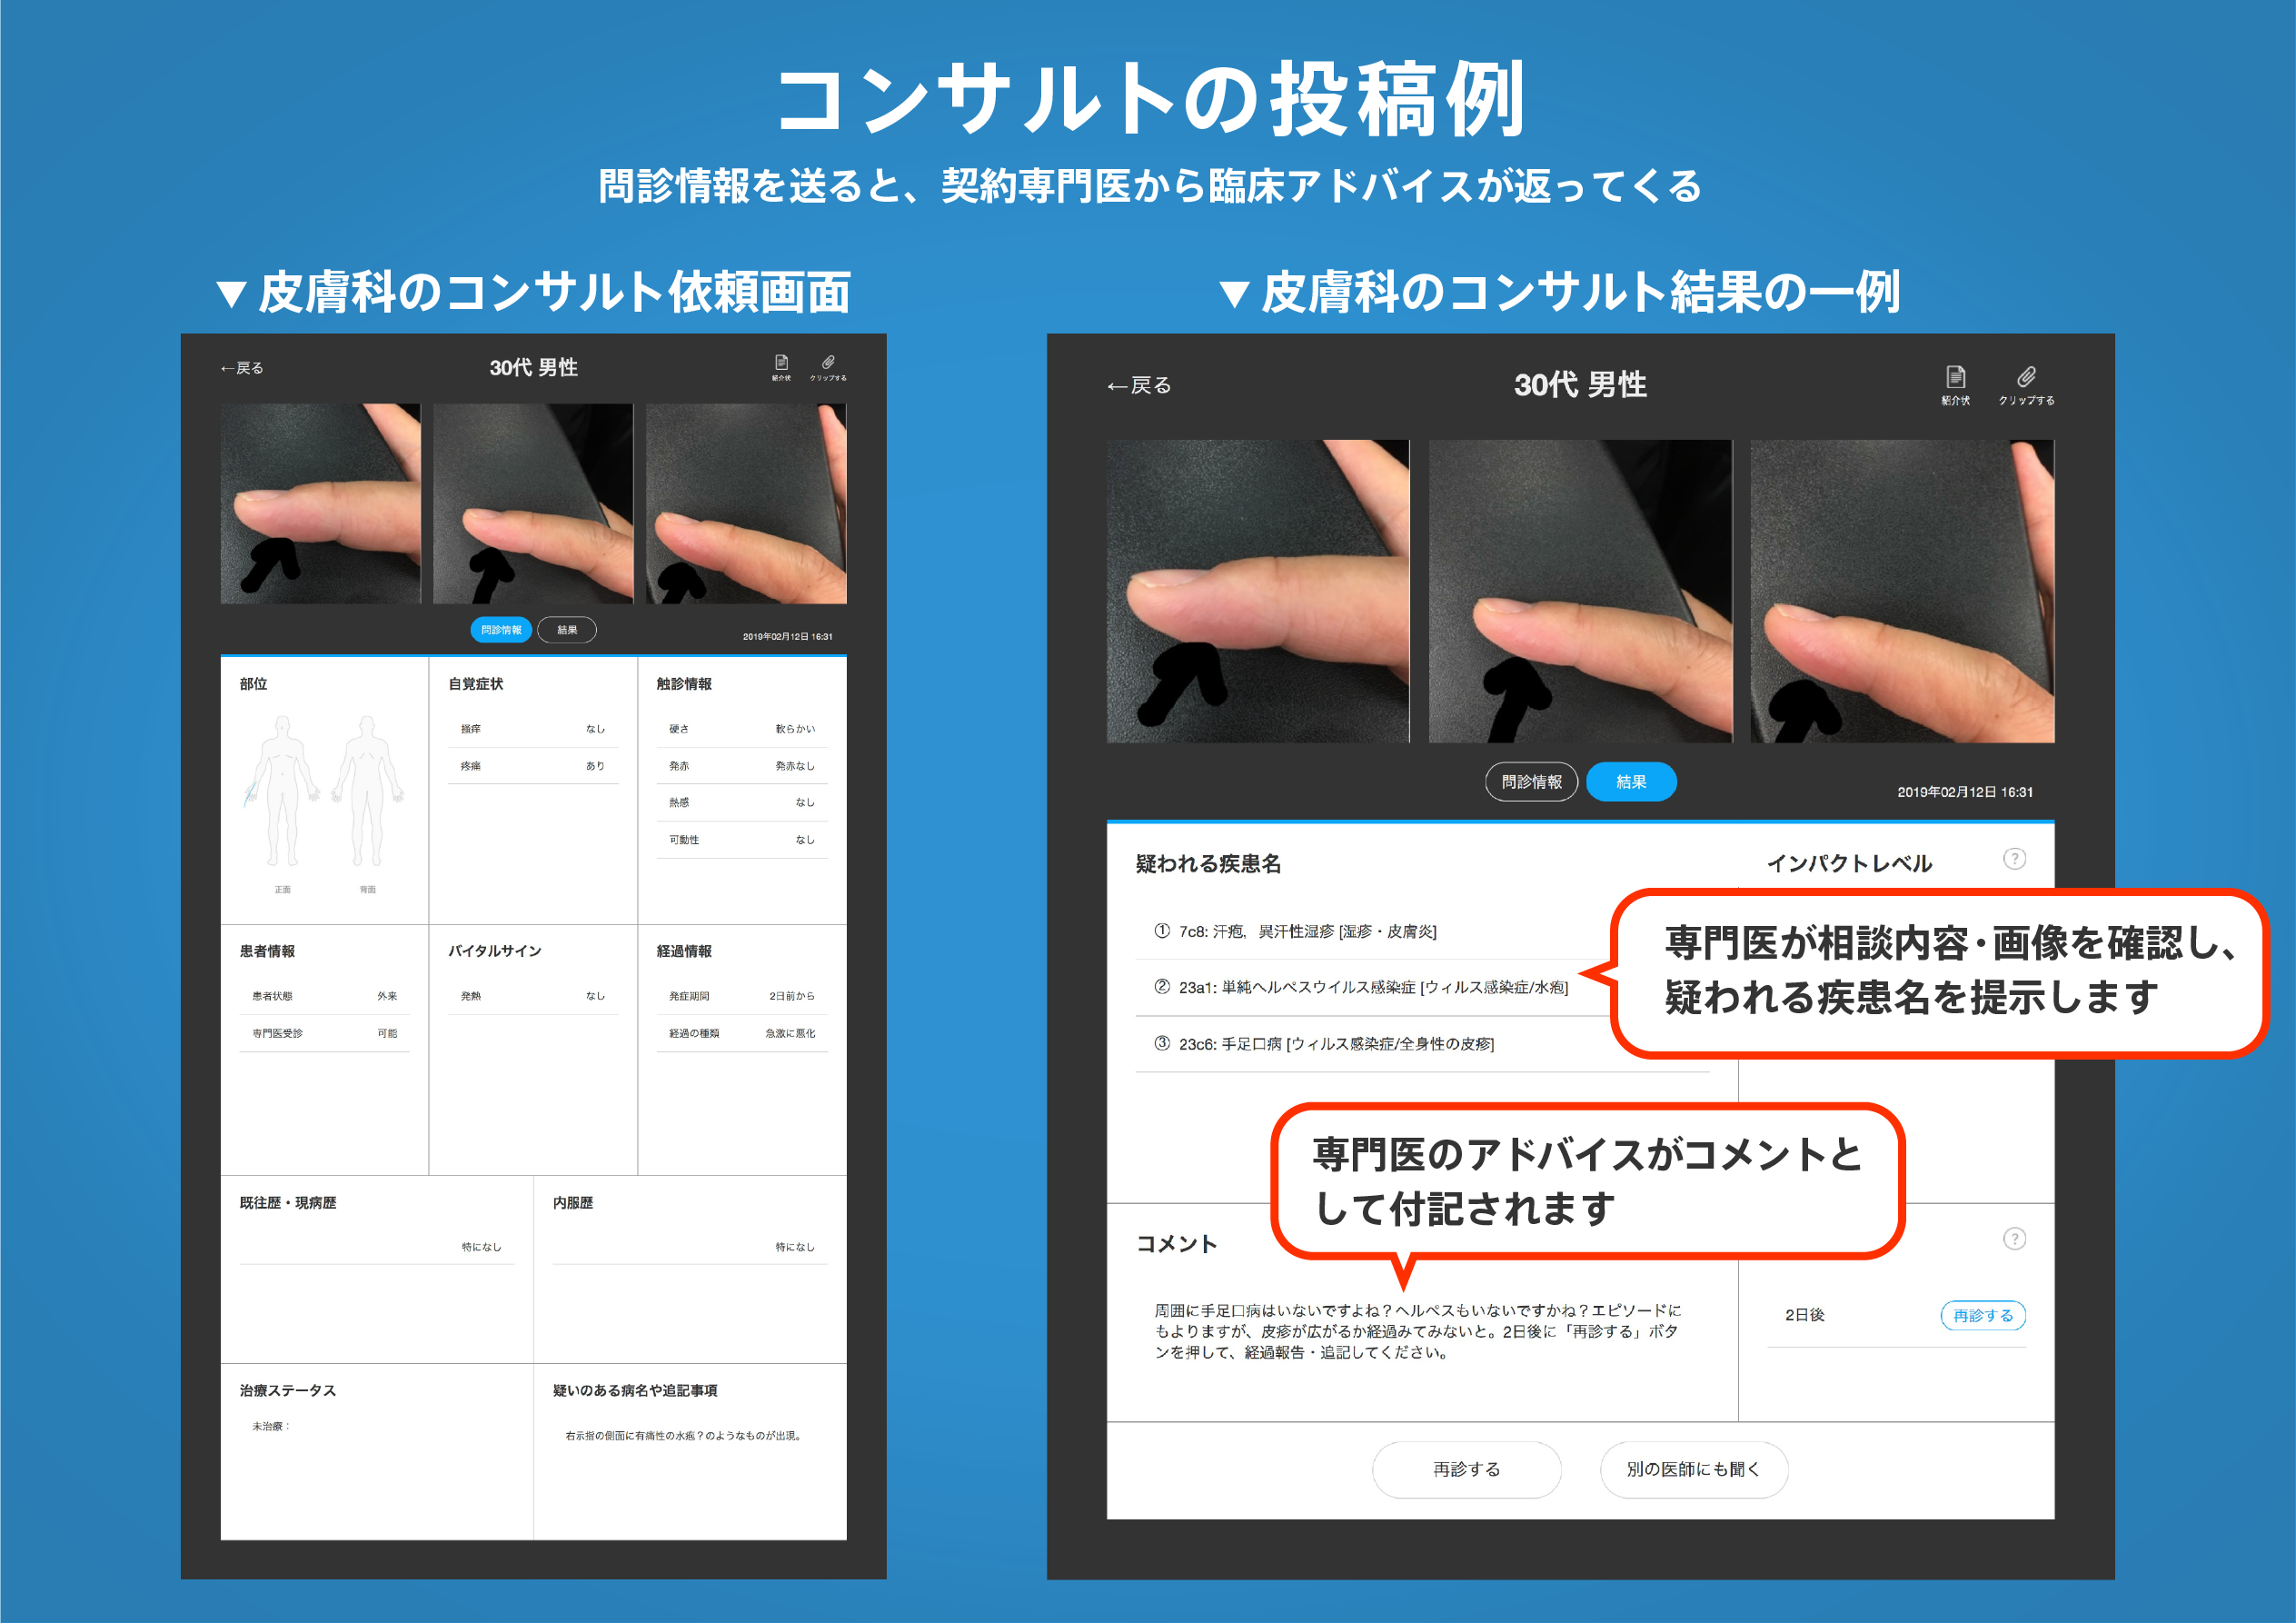
医師のための臨床サポートサービス
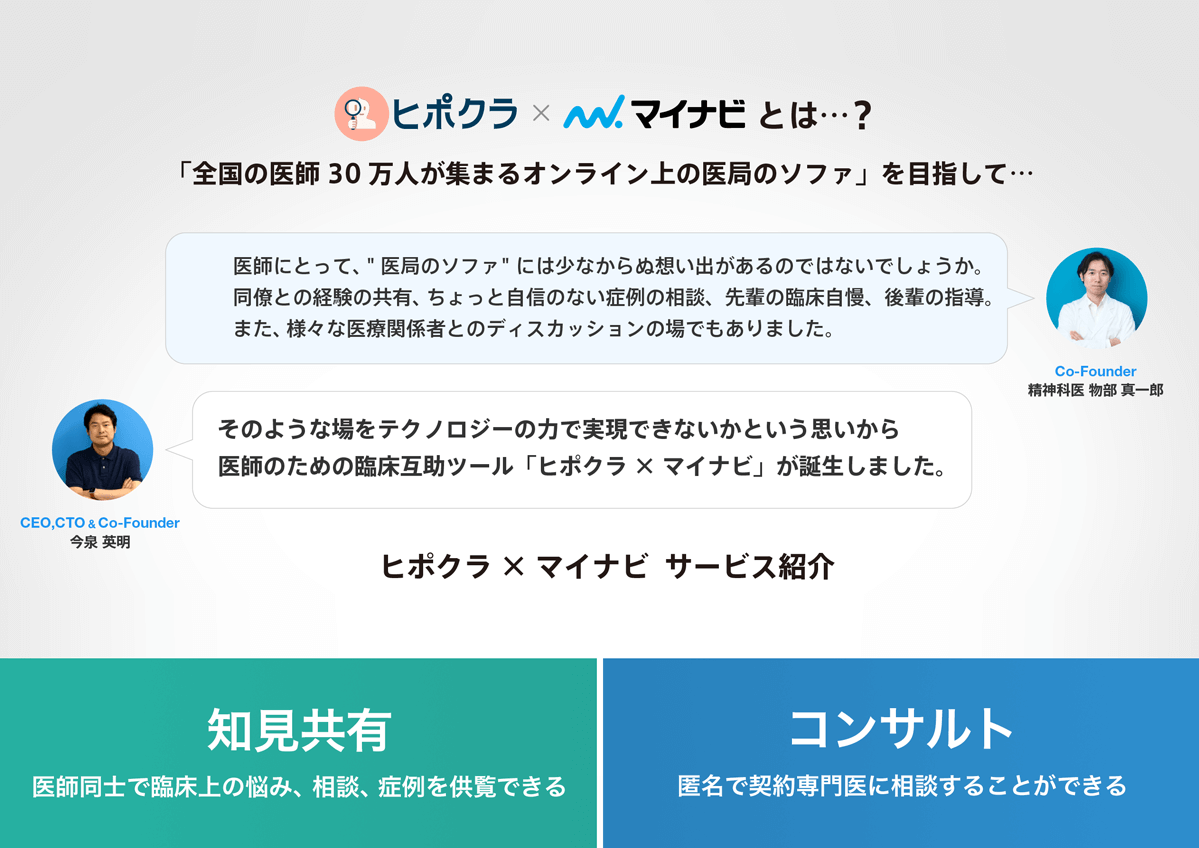
ヒポクラ x マイナビのご紹介
無料会員登録していただくと、さらに便利で効率的な検索が可能になります。

