著名医師による解説が無料で読めます
すると翻訳の精度が向上します
背景:矛盾する結果は、前立腺特異膜抗原(PSMA)ポジトロン放出断層撮影(PET)/コンピューター断層撮影(CT)と前立腺癌(PCA)の攻撃性に関するPSMA取り込み値(SUV)との関係について明らかにされています。この研究は、SUVとPCAの攻撃性との関係と、臨床的に重要なPCA(CSPCA)の評価におけるその役割とリスク層別化を検証することです。 方法:根治的前立腺切除(RP)の前に[68GA] -PSMA PET/CT(PET/CT)を受けた51人の患者を遡及的に登録しました。PET/CTの結果は、組織マウント全体で修正されました。SUVと攻撃性との関係は、グリーソンスコア、Tステージ、初期PSA、腫瘍サイズを含むイン発生装置に関連しています。PCA全体、CSPCA、および中間/高リスクPCAの検出のカットオフ値は、受信機の動作特性(ROC)分析によって計算されました。 結果:SUV <inf> max </inf>とsuv <inf>平均</inf>の両方がグリーソンスコアと正の相関があります(SUV <inf> max </inf> Spearman r = 0.546 p <0.01、SUV <inf>平均</inf>スピアマンr = 0.359 p <0.01)、PSAレベル(suv <inf> max </inf> spearman r = 0.568 p <0.01、suv <inf>平均</inf>スピアマンr = 0.529 p <0.01)および腫瘍体積SUV </max </inf> Spearman r = 0.635 p <0.01、Suv <inf>平均</inf>スピアマンr = 0.590 p <0.01)。T3期の腫瘍は、T2よりも著しいSUV取り込みがありました(SUV <inf> max </inf> 17.49±10.50 vs 9.90±8.7、p <0.01およびSUV <inf>平均</inf> 17.49±10.50対9.90±8.7、p <0.01)。ROC分析では、PCA全体の検出について、SUV <inf> max </inf>(3.8)およびSUV <inf>平均</inf>(2.8)のカットオフが示されました。ROC分析では、CSPCAと中間/高リスクのPCAがSUV <inf> max </inf>(8.4)とSUV <inf>平均</inf>(6.8)の両方で同じカットオフを持っていることが示されました。 結論:PSMA PET/CTでのPSMAの取り込みは、グリーソンスコア、Tステージ、初期PSA、腫瘍体積と正の相関がありました。suv <inf> max </inf>とsuv <inf>平均</inf>は、CSPCA検出とリスク分類のパラメーターとして適用できます。
背景:矛盾する結果は、前立腺特異膜抗原(PSMA)ポジトロン放出断層撮影(PET)/コンピューター断層撮影(CT)と前立腺癌(PCA)の攻撃性に関するPSMA取り込み値(SUV)との関係について明らかにされています。この研究は、SUVとPCAの攻撃性との関係と、臨床的に重要なPCA(CSPCA)の評価におけるその役割とリスク層別化を検証することです。 方法:根治的前立腺切除(RP)の前に[68GA] -PSMA PET/CT(PET/CT)を受けた51人の患者を遡及的に登録しました。PET/CTの結果は、組織マウント全体で修正されました。SUVと攻撃性との関係は、グリーソンスコア、Tステージ、初期PSA、腫瘍サイズを含むイン発生装置に関連しています。PCA全体、CSPCA、および中間/高リスクPCAの検出のカットオフ値は、受信機の動作特性(ROC)分析によって計算されました。 結果:SUV <inf> max </inf>とsuv <inf>平均</inf>の両方がグリーソンスコアと正の相関があります(SUV <inf> max </inf> Spearman r = 0.546 p <0.01、SUV <inf>平均</inf>スピアマンr = 0.359 p <0.01)、PSAレベル(suv <inf> max </inf> spearman r = 0.568 p <0.01、suv <inf>平均</inf>スピアマンr = 0.529 p <0.01)および腫瘍体積SUV </max </inf> Spearman r = 0.635 p <0.01、Suv <inf>平均</inf>スピアマンr = 0.590 p <0.01)。T3期の腫瘍は、T2よりも著しいSUV取り込みがありました(SUV <inf> max </inf> 17.49±10.50 vs 9.90±8.7、p <0.01およびSUV <inf>平均</inf> 17.49±10.50対9.90±8.7、p <0.01)。ROC分析では、PCA全体の検出について、SUV <inf> max </inf>(3.8)およびSUV <inf>平均</inf>(2.8)のカットオフが示されました。ROC分析では、CSPCAと中間/高リスクのPCAがSUV <inf> max </inf>(8.4)とSUV <inf>平均</inf>(6.8)の両方で同じカットオフを持っていることが示されました。 結論:PSMA PET/CTでのPSMAの取り込みは、グリーソンスコア、Tステージ、初期PSA、腫瘍体積と正の相関がありました。suv <inf> max </inf>とsuv <inf>平均</inf>は、CSPCA検出とリスク分類のパラメーターとして適用できます。
BACKGROUND: Conflicting results have been revealed on the relationship between PSMA uptake values (SUVs) on prostate-specific membrane antigen (PSMA) positron emission tomography (PET)/computed tomography (CT) and prostate cancer (PCa) aggressiveness. This study is to validate the relationship between SUVs with PCa aggressiveness and its role in evaluation of clinically significant PCa (csPCa) and risk stratification. METHODS: We retrospectively enrolled 51 patients who underwent [68Ga]-PSMA PET/CT (PET/CT) before radical prostatectomy (RP). PET/CT results were corrected with whole mount histology. The relationship between SUVs and aggressiveness related indictors including Gleason score, T stage, initial PSA and tumor size were analyzed. The cutoff value for detection of overall PCa, csPCa and intermediate/high-risk PCa were calculated by receiver operating characteristics (ROC) analysis. RESULTS: Both SUV<inf>max</inf> and SUV<inf>mean</inf> positively correlated with Gleason score (SUV<inf>max</inf> Spearman r=0.546 P<0.01, SUV<inf>mean</inf> Spearman r=0.359 P<0.01), PSA level (SUV<inf>max</inf> Spearman r=0.568 P<0.01, SUV<inf>mean</inf> Spearman r=0.529 P<0.01) and tumor volume SUV<inf>max</inf> Spearman r=0.635 P<0.01, SUV<inf>mean</inf> Spearman r=0.590 P<0.01). Tumors with T3 stage had significant higher SUV uptake than T2 (SUV<inf>max</inf> 17.49±10.50 vs 9.90±8.7, P<0.01 and SUV<inf>mean</inf> 17.49±10.50 vs 9.90±8.7, P<0.01). ROC analysis showed cutoff of SUV<inf>max</inf> (3.8) and SUV<inf>mean</inf> (2.8) for overall PCa detection. ROC analysis showed that csPCa and intermediate/high risk PCa had the same cutoff on both SUV<inf>max</inf> (8.4) and SUV<inf>mean</inf> (6.8). CONCLUSIONS: PSMA uptake on PSMA PET/CT positively correlated with Gleason score, T stage, initial PSA and tumor volume. Both SUV<inf>max</inf> and SUV<inf>mean</inf> can be applied as parameters for csPCa detection and risk classification.
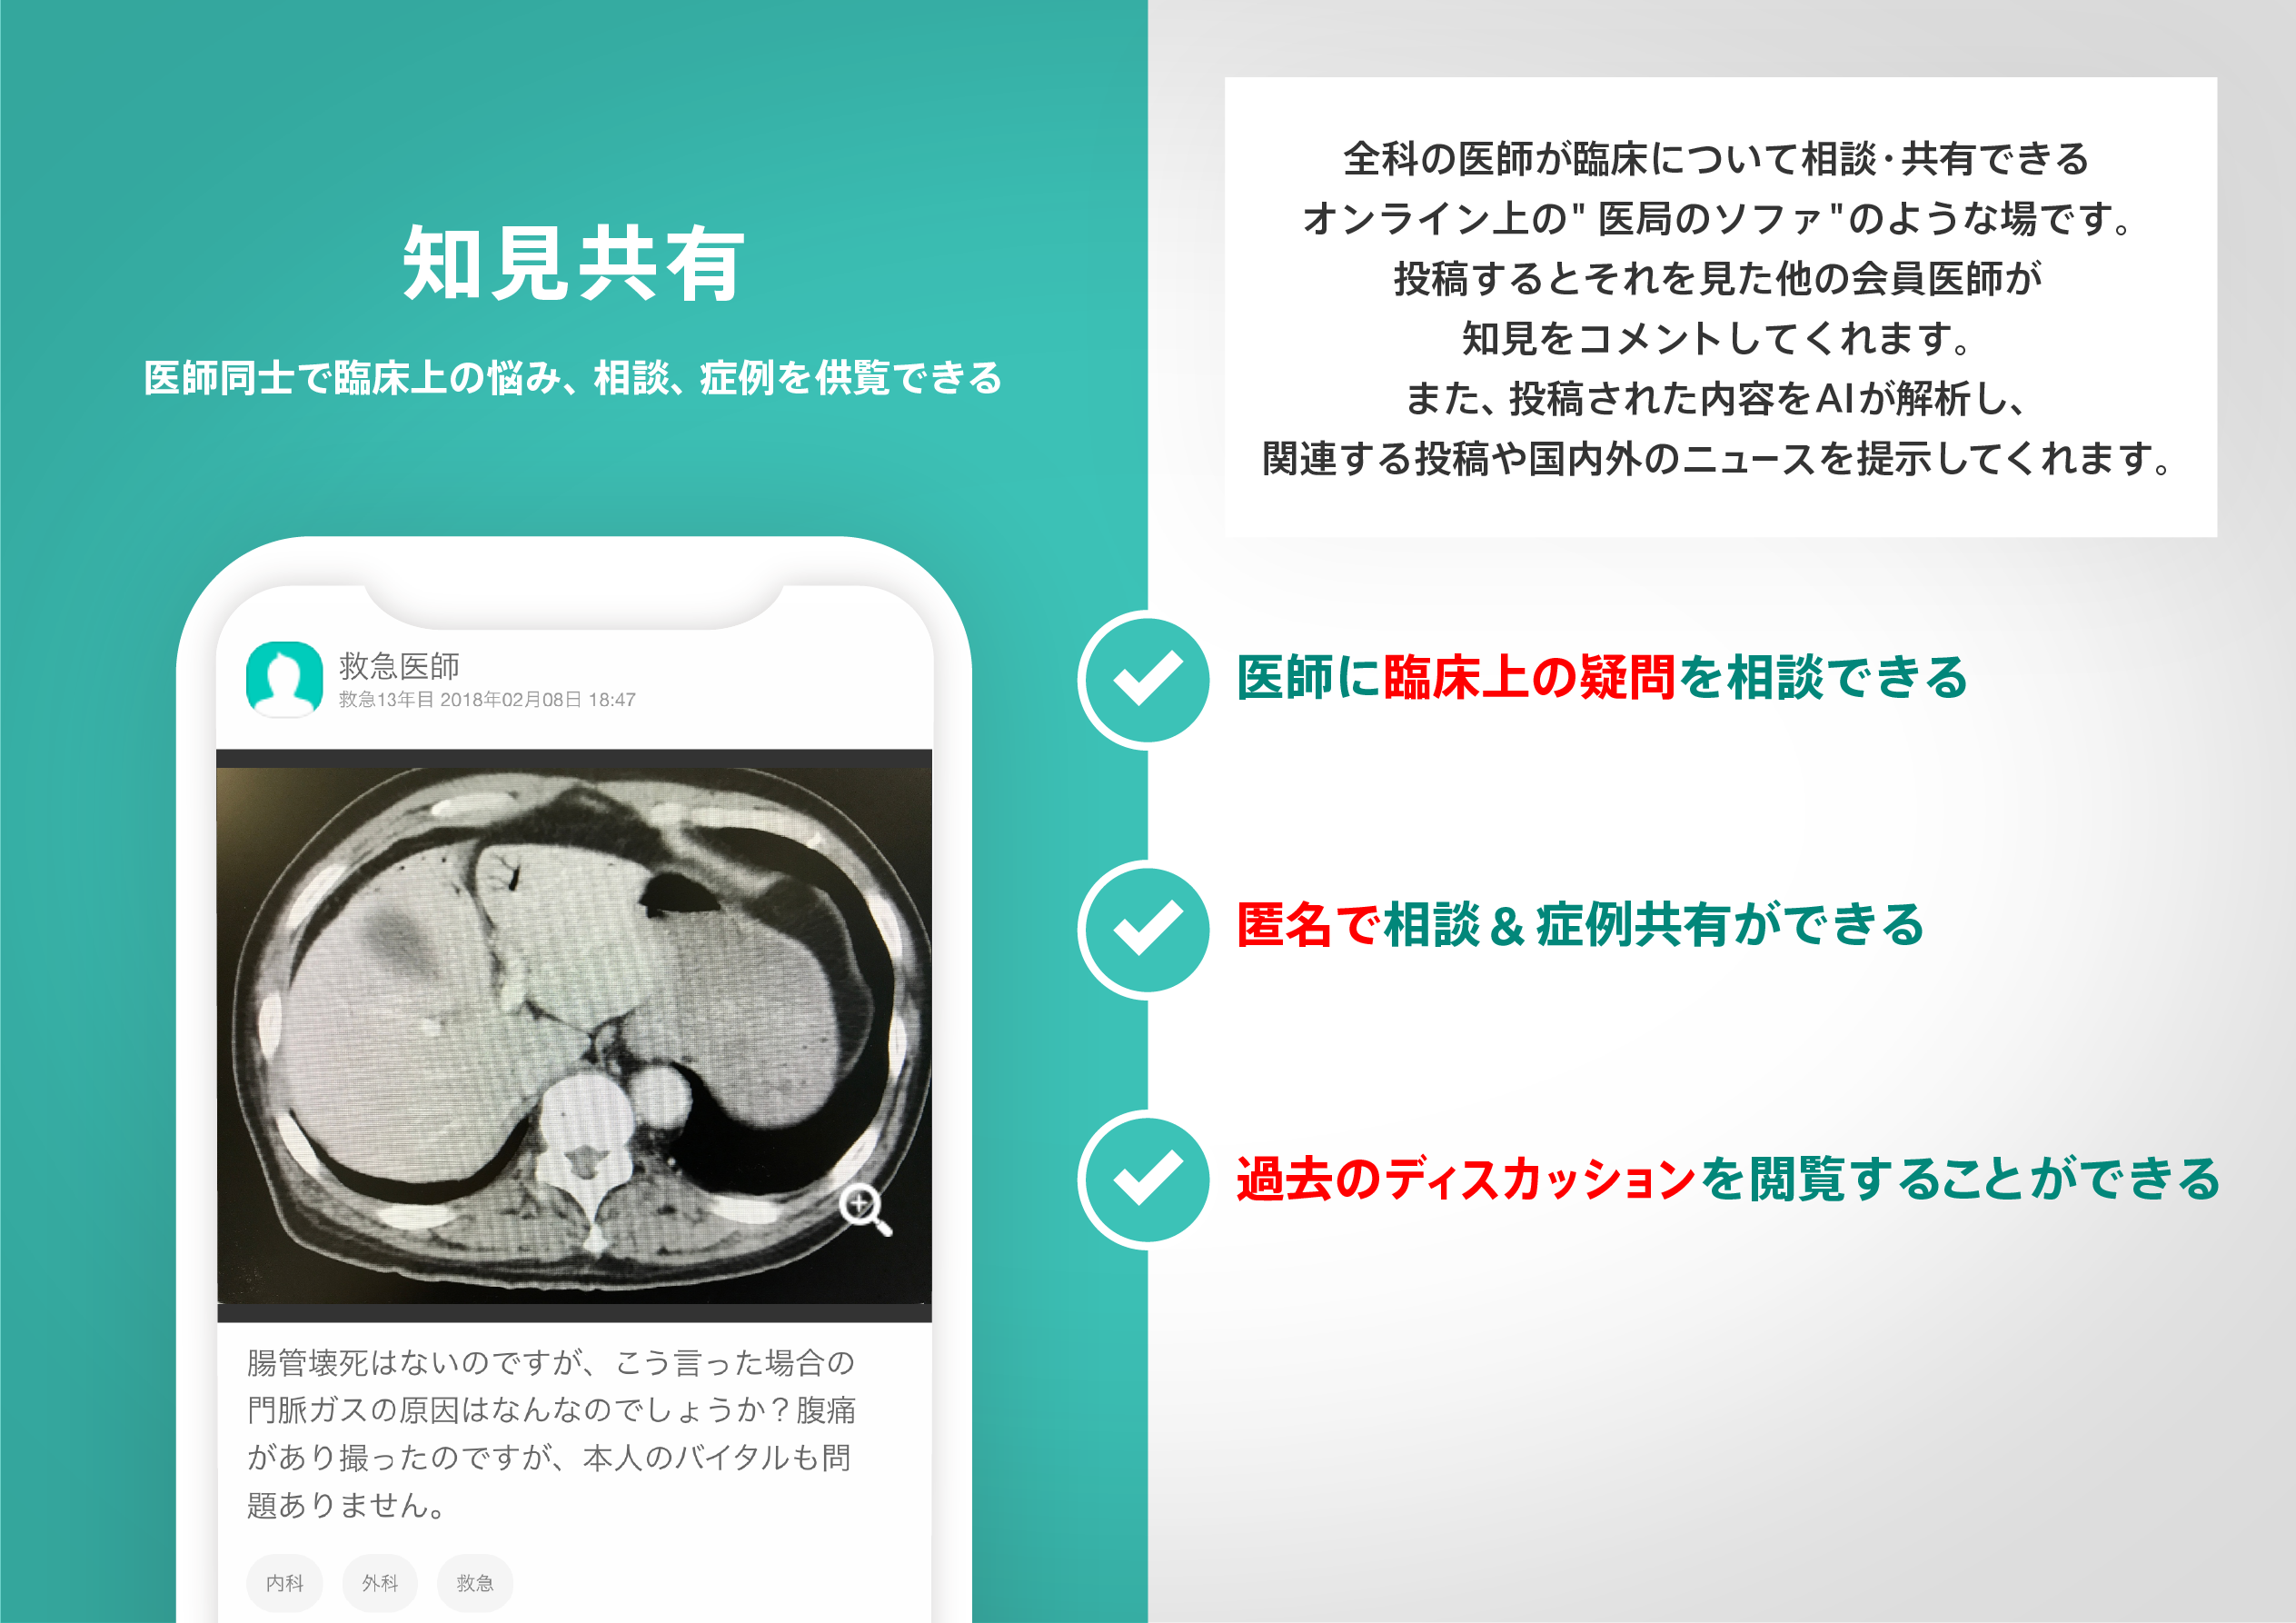
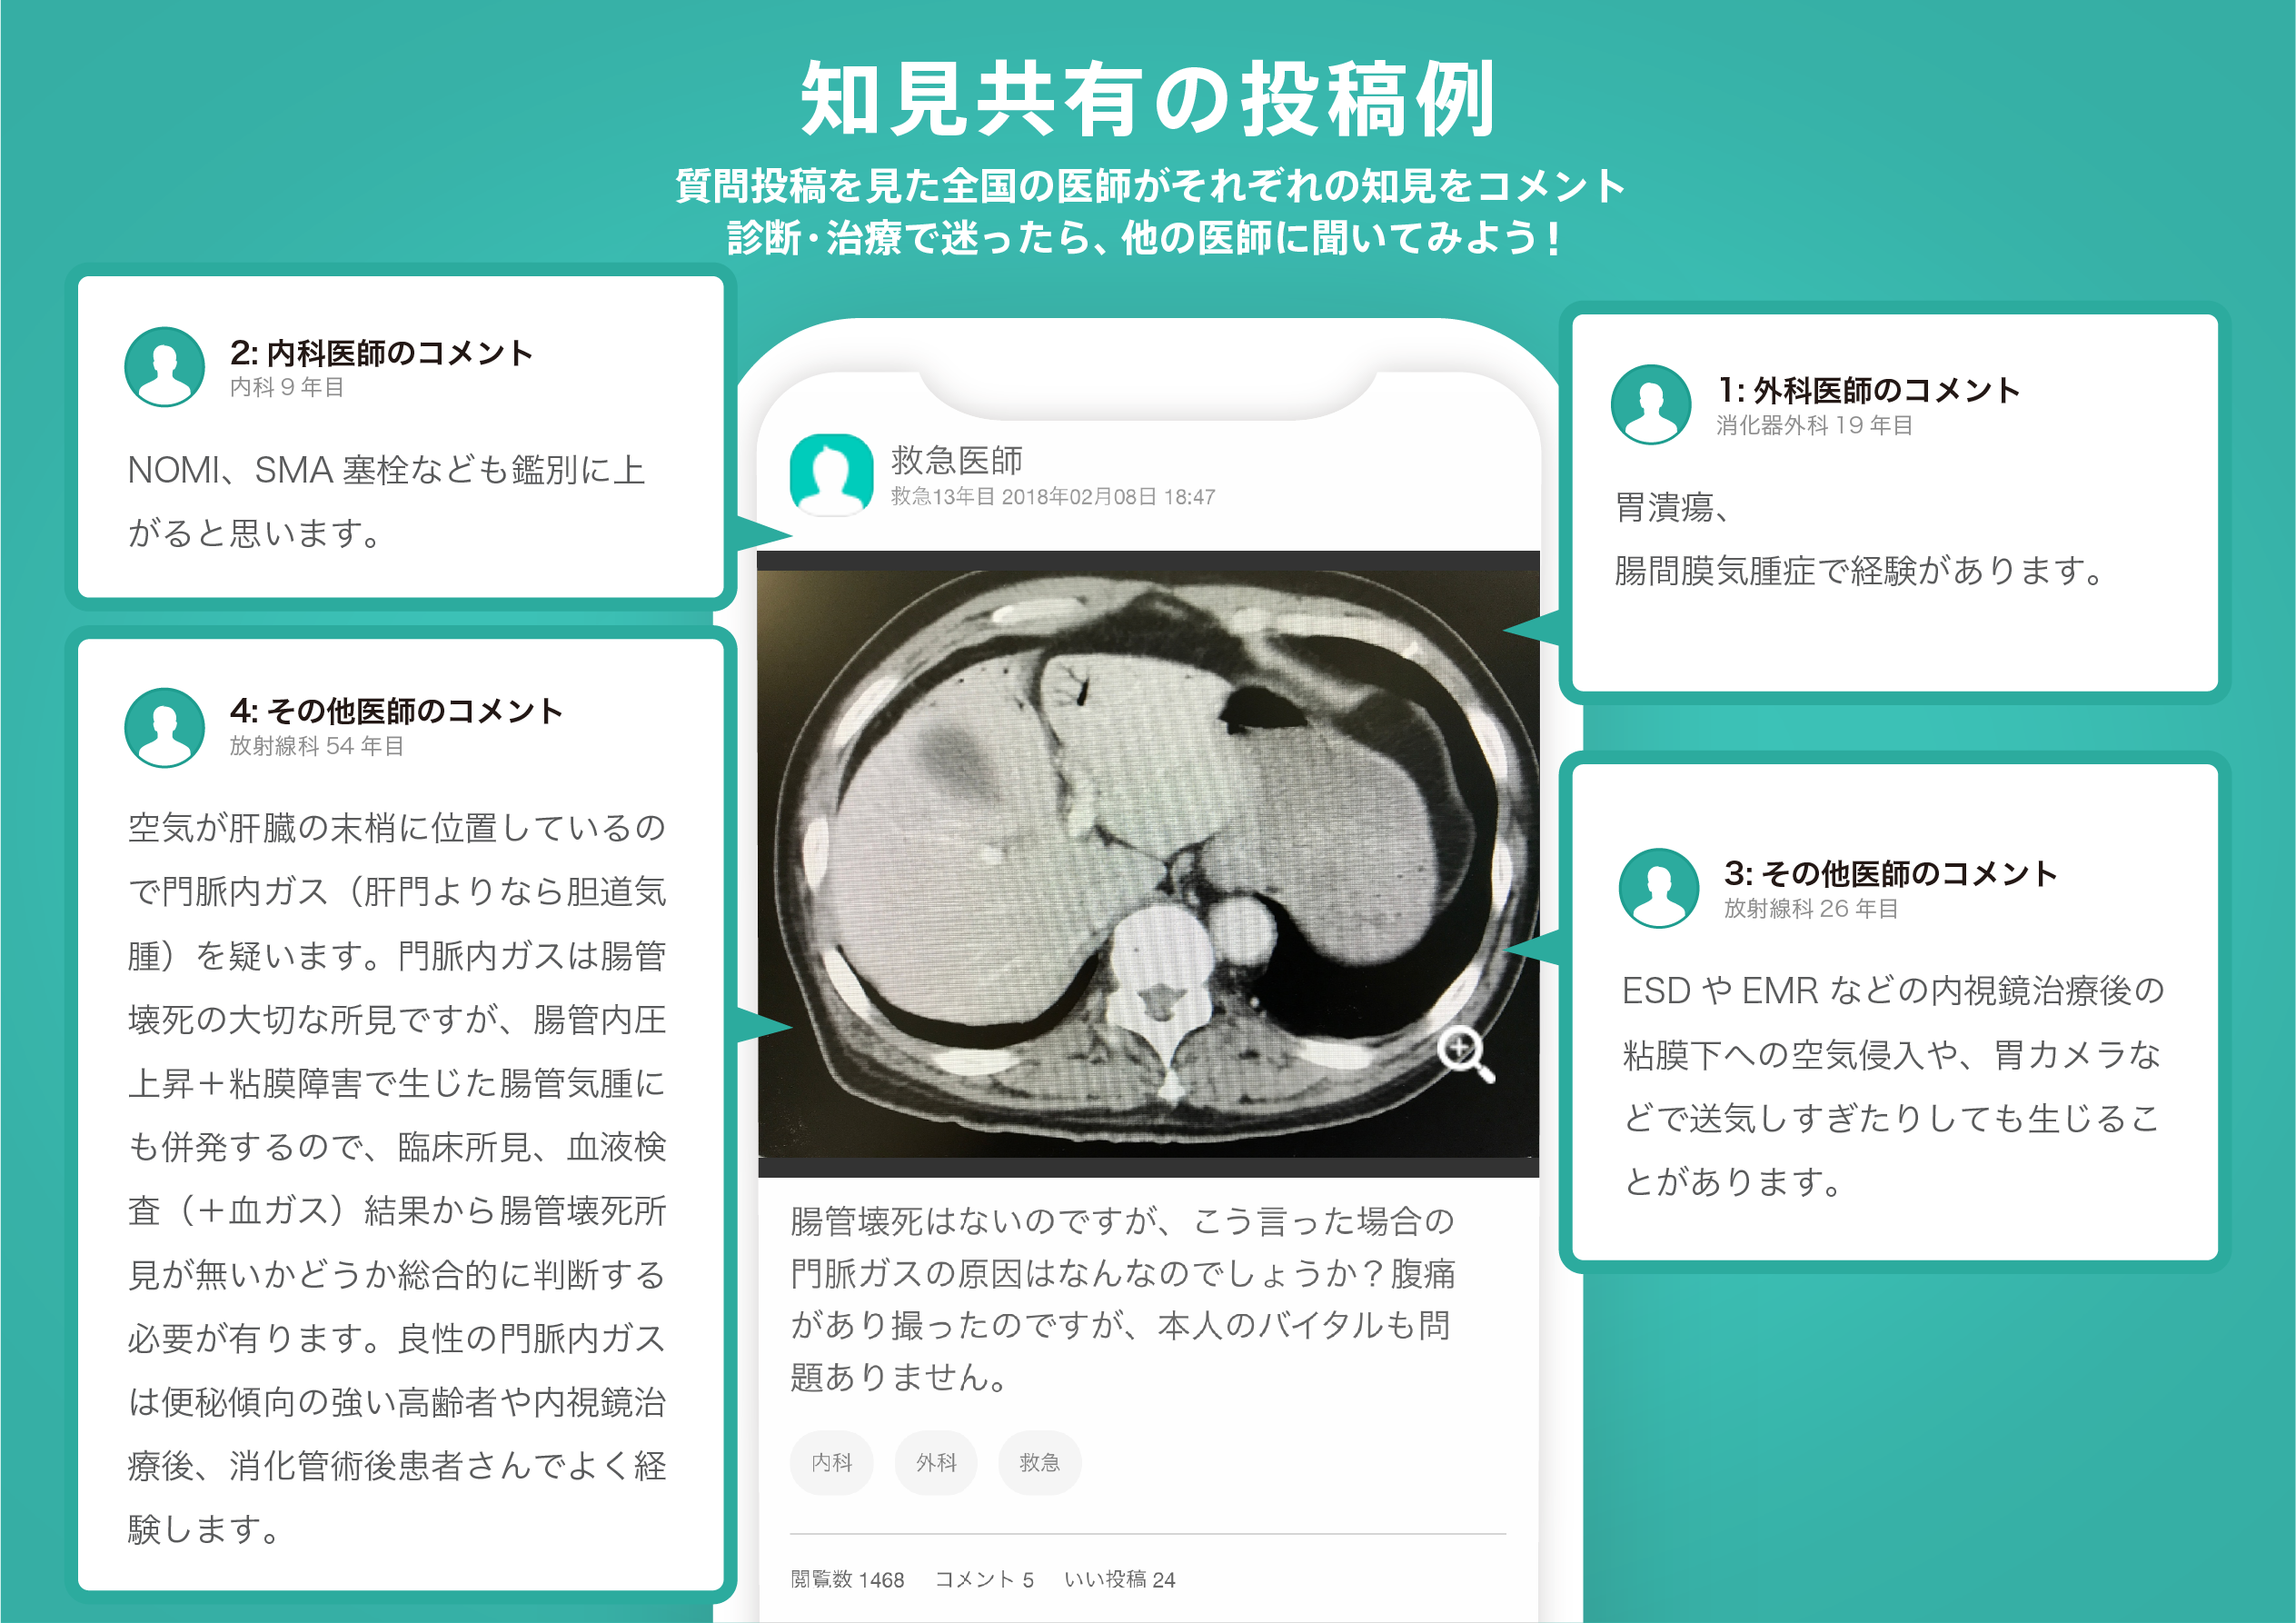
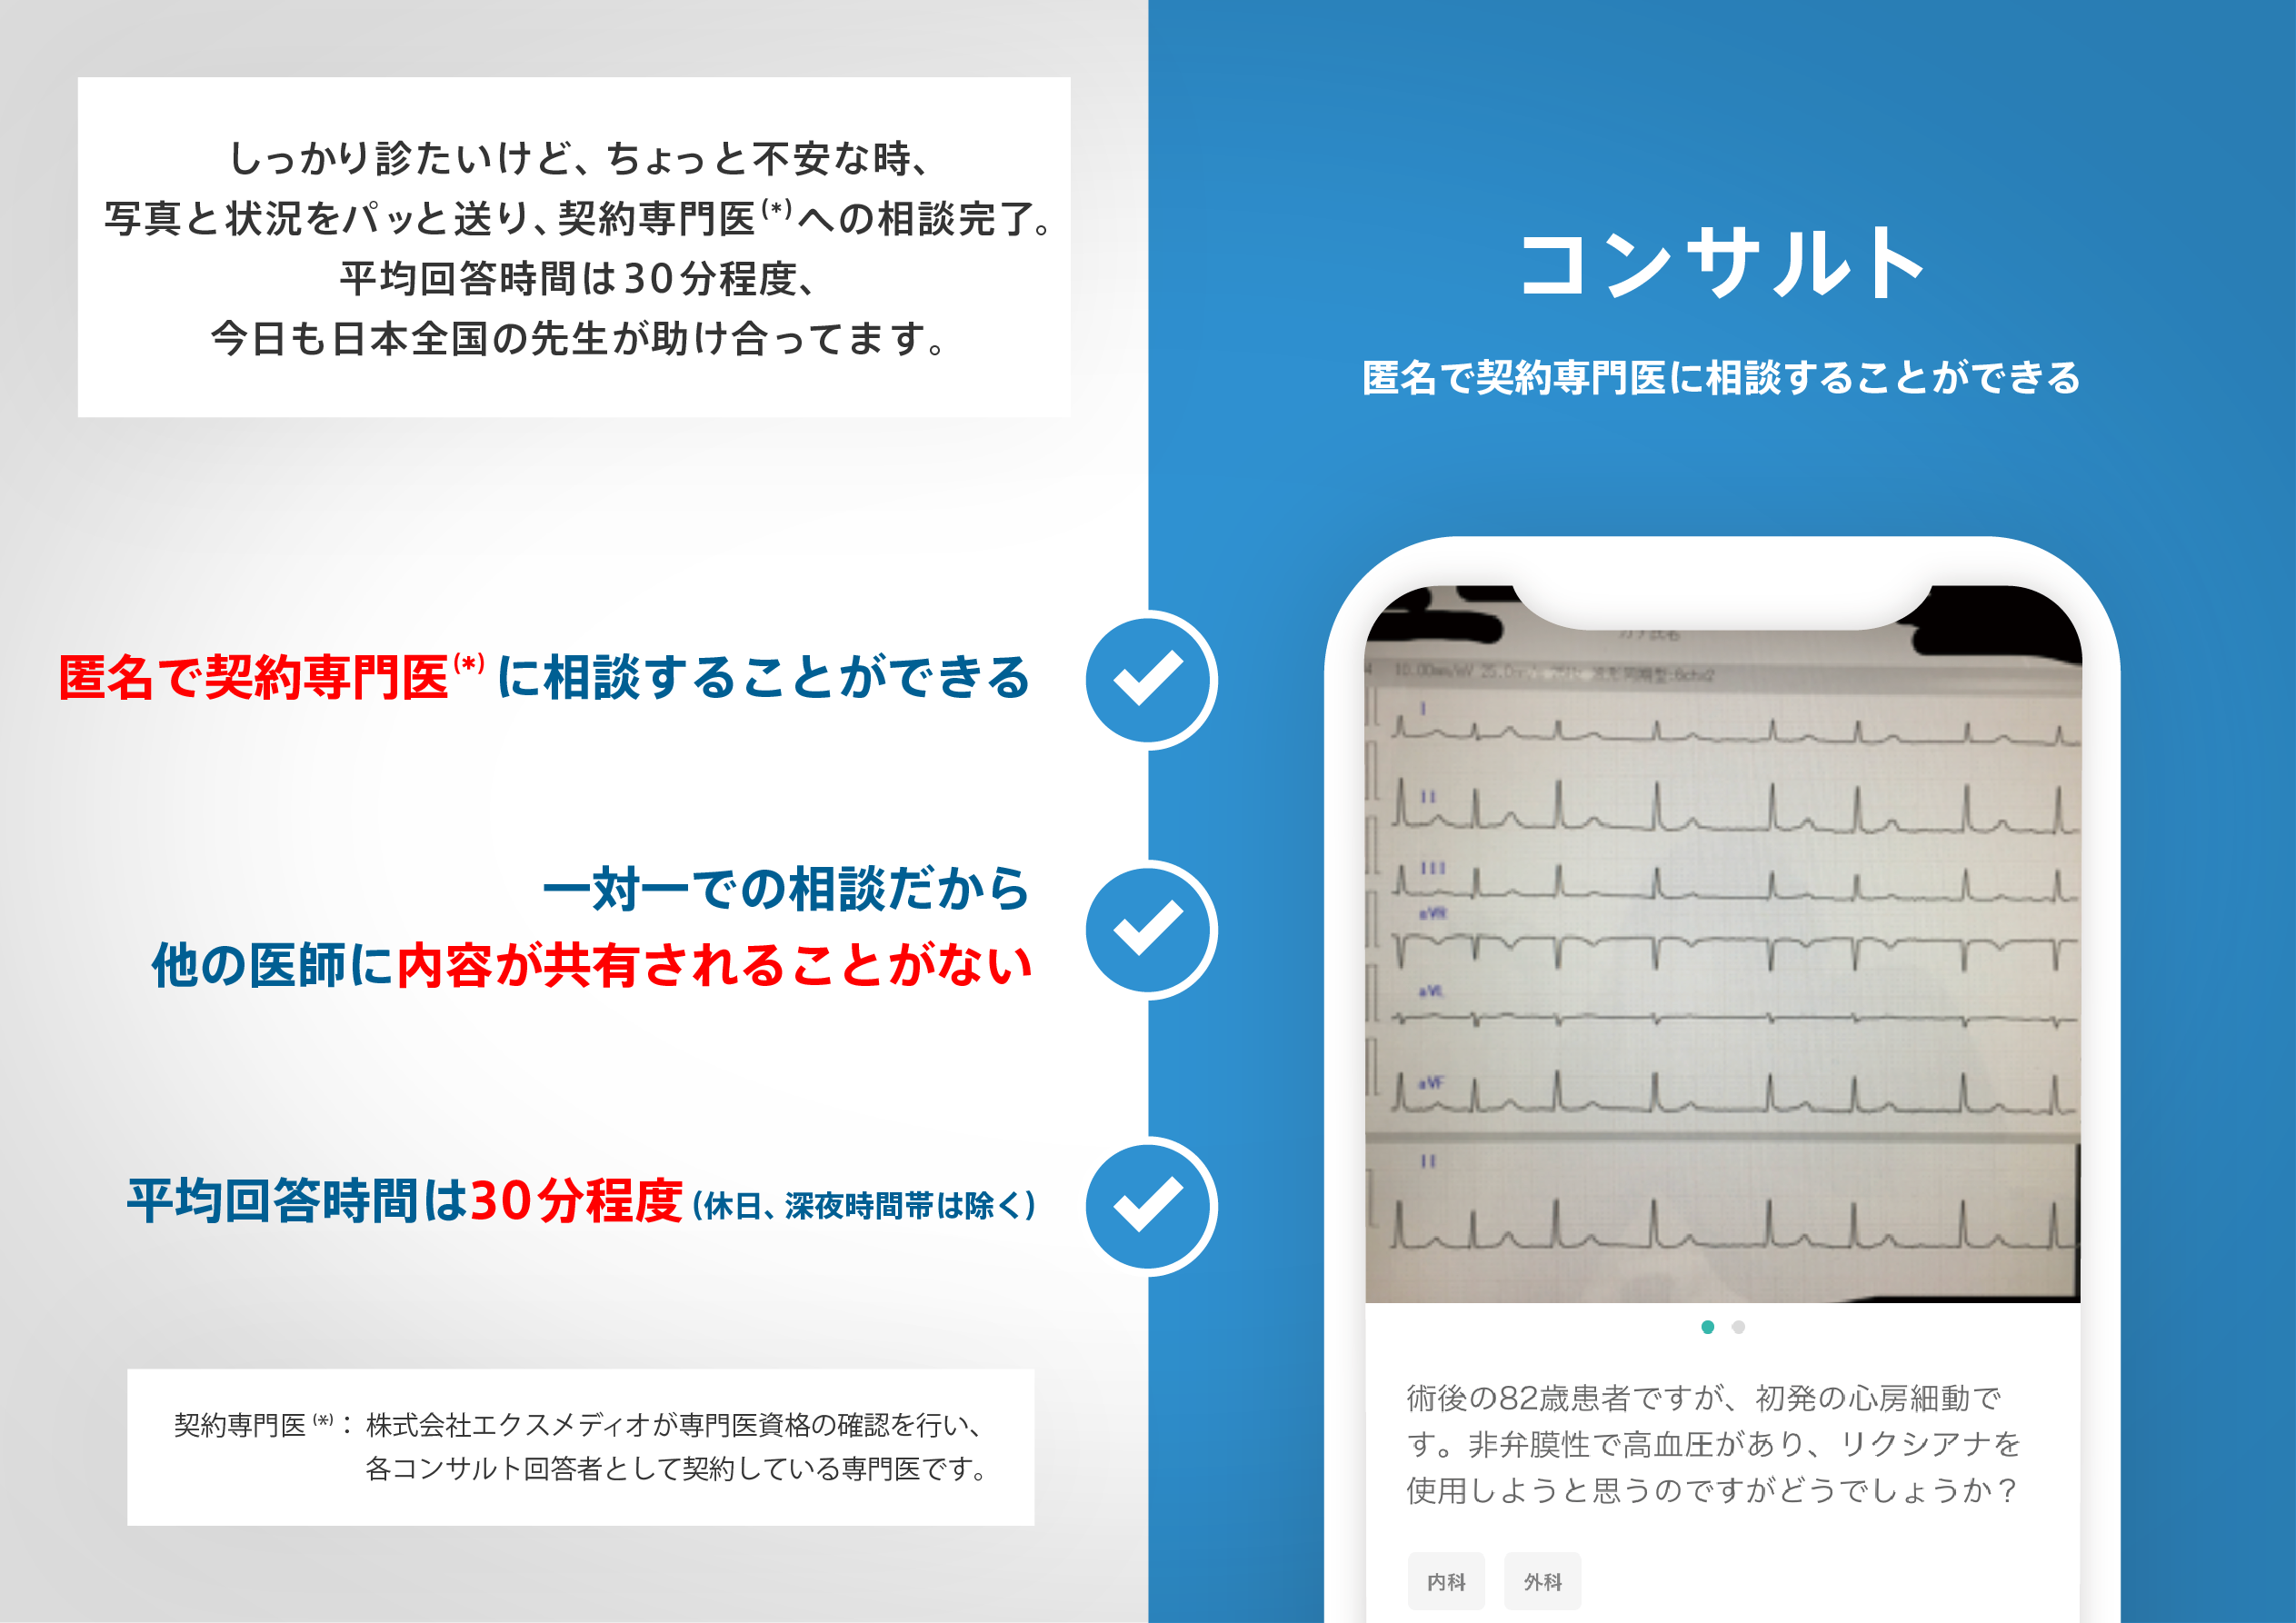
医師のための臨床サポートサービス
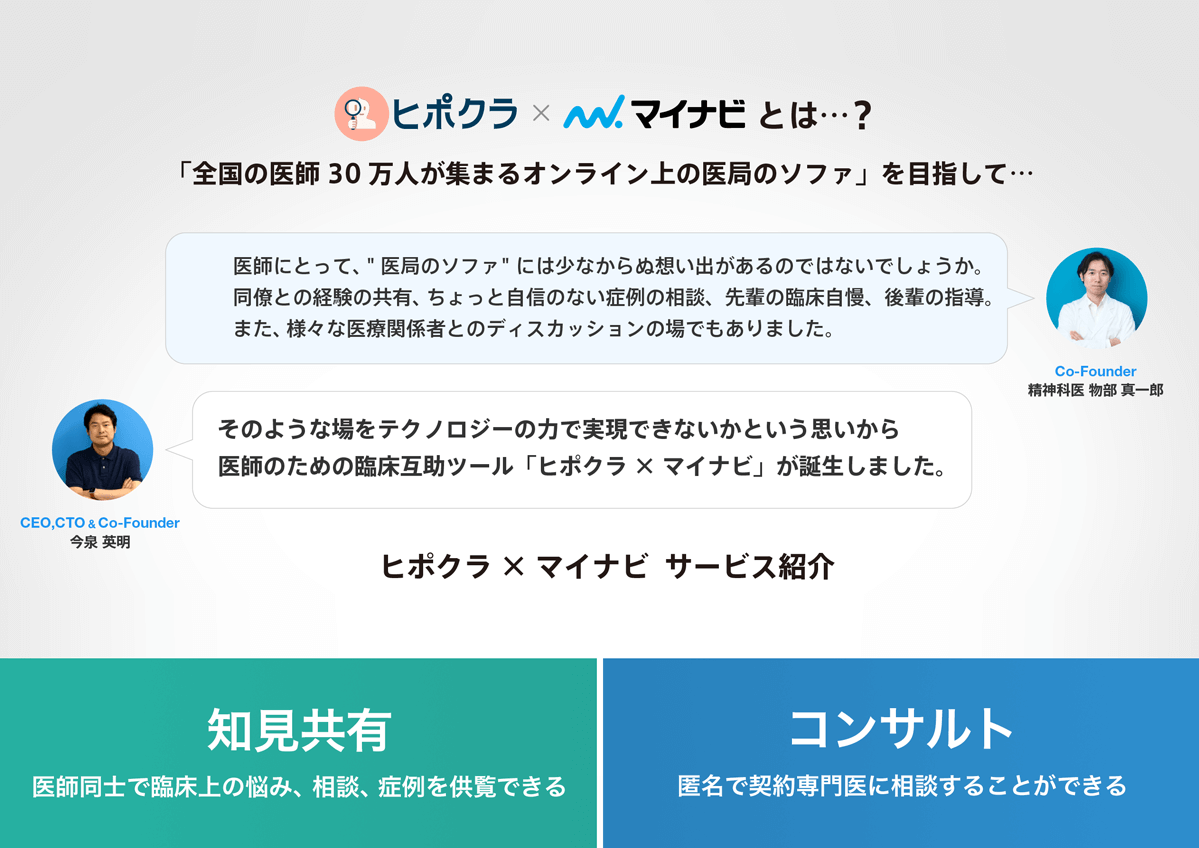
ヒポクラ x マイナビのご紹介
無料会員登録していただくと、さらに便利で効率的な検索が可能になります。

