著名医師による解説が無料で読めます
すると翻訳の精度が向上します
尿酸の分布量は、細胞外水(ECW)の量の影響を受けますが、尿素分布量は全身水(TBW)と見なすことができます。したがって、尿酸と尿素の分布量の比率は、ECW/TBWのプロキシと並行して考慮することができます。当社の施設に合計108人の患者が含まれていました。尿酸および尿素分布体積比(UUVDR)は、単一プールモデルから計算されました。これは、バイオインダンスインデックスが測定された時間の1か月以内に測定されました。HDセッションの終了時のECW/TBWは、Inbody S10によって測定されました。UUVDRとECW/TBW値との関連性と、回帰方程式の残差に影響する要因を調査しました。また、ランダムに選択された2つのグループ、すなわちトレーニンググループと検証グループで、過hydrationまたは脱水の予測能力を評価しました。ECW/TBWはUUVDRと高度に相関していました。多変量解析により、クレアチニンとECW/TBWのみが回帰残差と有意に関連していることが実証されました。トレーニンググループでは、過水和と脱水のUUVDRのカットオフ値はそれぞれ0.666および0.579でした。それらのAUCはそれぞれ0.872と0.898でした。検証群の感度と特異性の値は、過水水式で0.571および0.868、脱水でそれぞれ0.444および0.953でした。UUVDRは、血液透析患者の水分補給状況の代理である可能性があります。疫学研究では、専用のデバイスなしで水分補給状態を予測することが可能かもしれません。
尿酸の分布量は、細胞外水(ECW)の量の影響を受けますが、尿素分布量は全身水(TBW)と見なすことができます。したがって、尿酸と尿素の分布量の比率は、ECW/TBWのプロキシと並行して考慮することができます。当社の施設に合計108人の患者が含まれていました。尿酸および尿素分布体積比(UUVDR)は、単一プールモデルから計算されました。これは、バイオインダンスインデックスが測定された時間の1か月以内に測定されました。HDセッションの終了時のECW/TBWは、Inbody S10によって測定されました。UUVDRとECW/TBW値との関連性と、回帰方程式の残差に影響する要因を調査しました。また、ランダムに選択された2つのグループ、すなわちトレーニンググループと検証グループで、過hydrationまたは脱水の予測能力を評価しました。ECW/TBWはUUVDRと高度に相関していました。多変量解析により、クレアチニンとECW/TBWのみが回帰残差と有意に関連していることが実証されました。トレーニンググループでは、過水和と脱水のUUVDRのカットオフ値はそれぞれ0.666および0.579でした。それらのAUCはそれぞれ0.872と0.898でした。検証群の感度と特異性の値は、過水水式で0.571および0.868、脱水でそれぞれ0.444および0.953でした。UUVDRは、血液透析患者の水分補給状況の代理である可能性があります。疫学研究では、専用のデバイスなしで水分補給状態を予測することが可能かもしれません。
The distribution volume of uric acid is affected by the amount of extracellular water (ECW), while urea distribution volume can be considered as total body water (TBW). Thus, the ratio of distribution volumes of uric acid and urea can be paralleled to and be considered as the proxy of ECW/TBW. A total of 108 patients at our facility was included. The uric acid and urea distribution volume ratio (UUVdR) calculated from the single-pool model, which was measured within 1 month of the time when the bioimpedance index was measured. ECW/TBW at the end of the HD session was measured by InBody S10. We investigated the association between the UUVdR and the ECW/TBW values and the factors affecting the residuals of the regression equation. We also evaluated the predictive ability of overhydration or dehydration in randomly selected two groups, i.e., the training group and the validation group. ECW/TBW correlated highly with UUVdR. Multivariate analysis demonstrated that only creatinine and ECW/TBW were significantly associated with regression residuals. The cutoff values of UUVdR for overhydration and dehydration were 0.666 and 0.579, respectively, in the training group. Their AUC were 0.872 and 0.898, respectively. The sensitivity and specificity values in the validation group were 0.571 and 0.868 for overhydration, and 0.444 and 0.953 for dehydration, respectively. UUVdR might be a proxy of hydration status in hemodialysis patients. It may be possible to predict hydration status without dedicated devices in the epidemiological study.
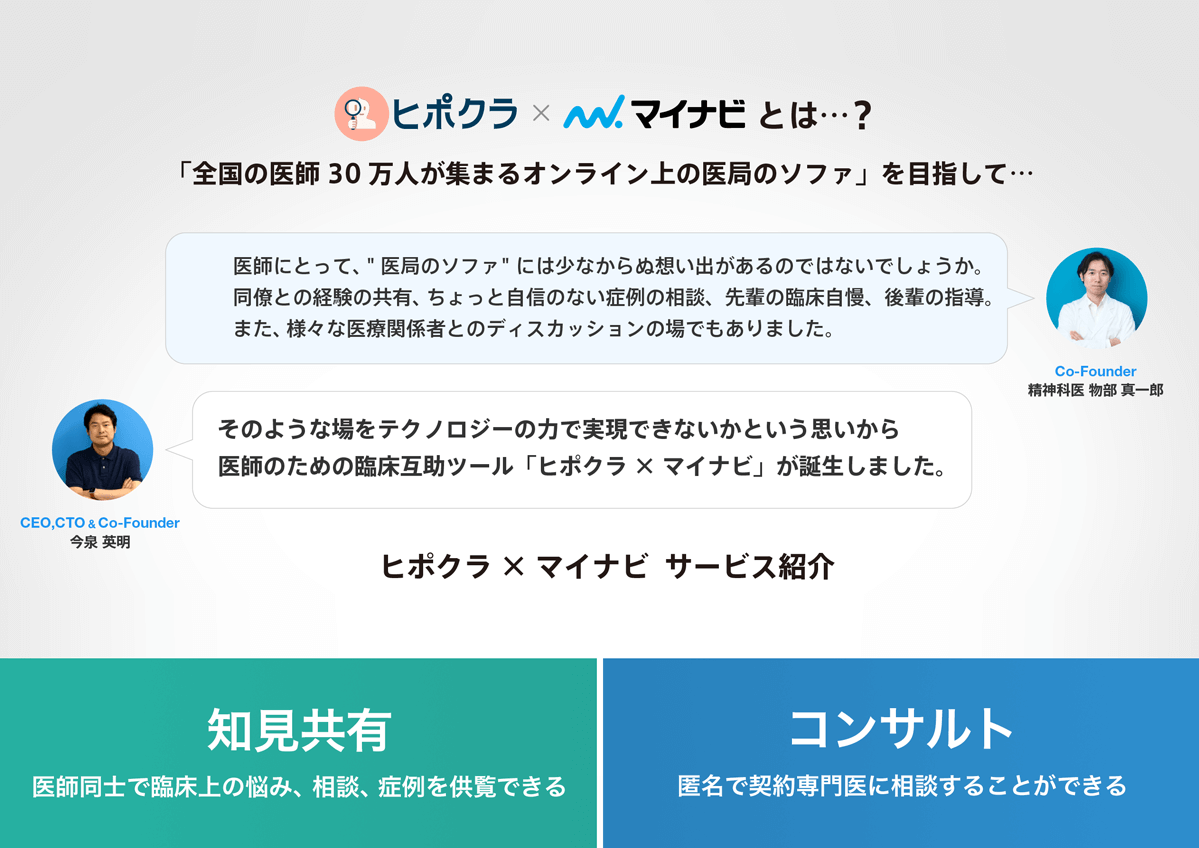
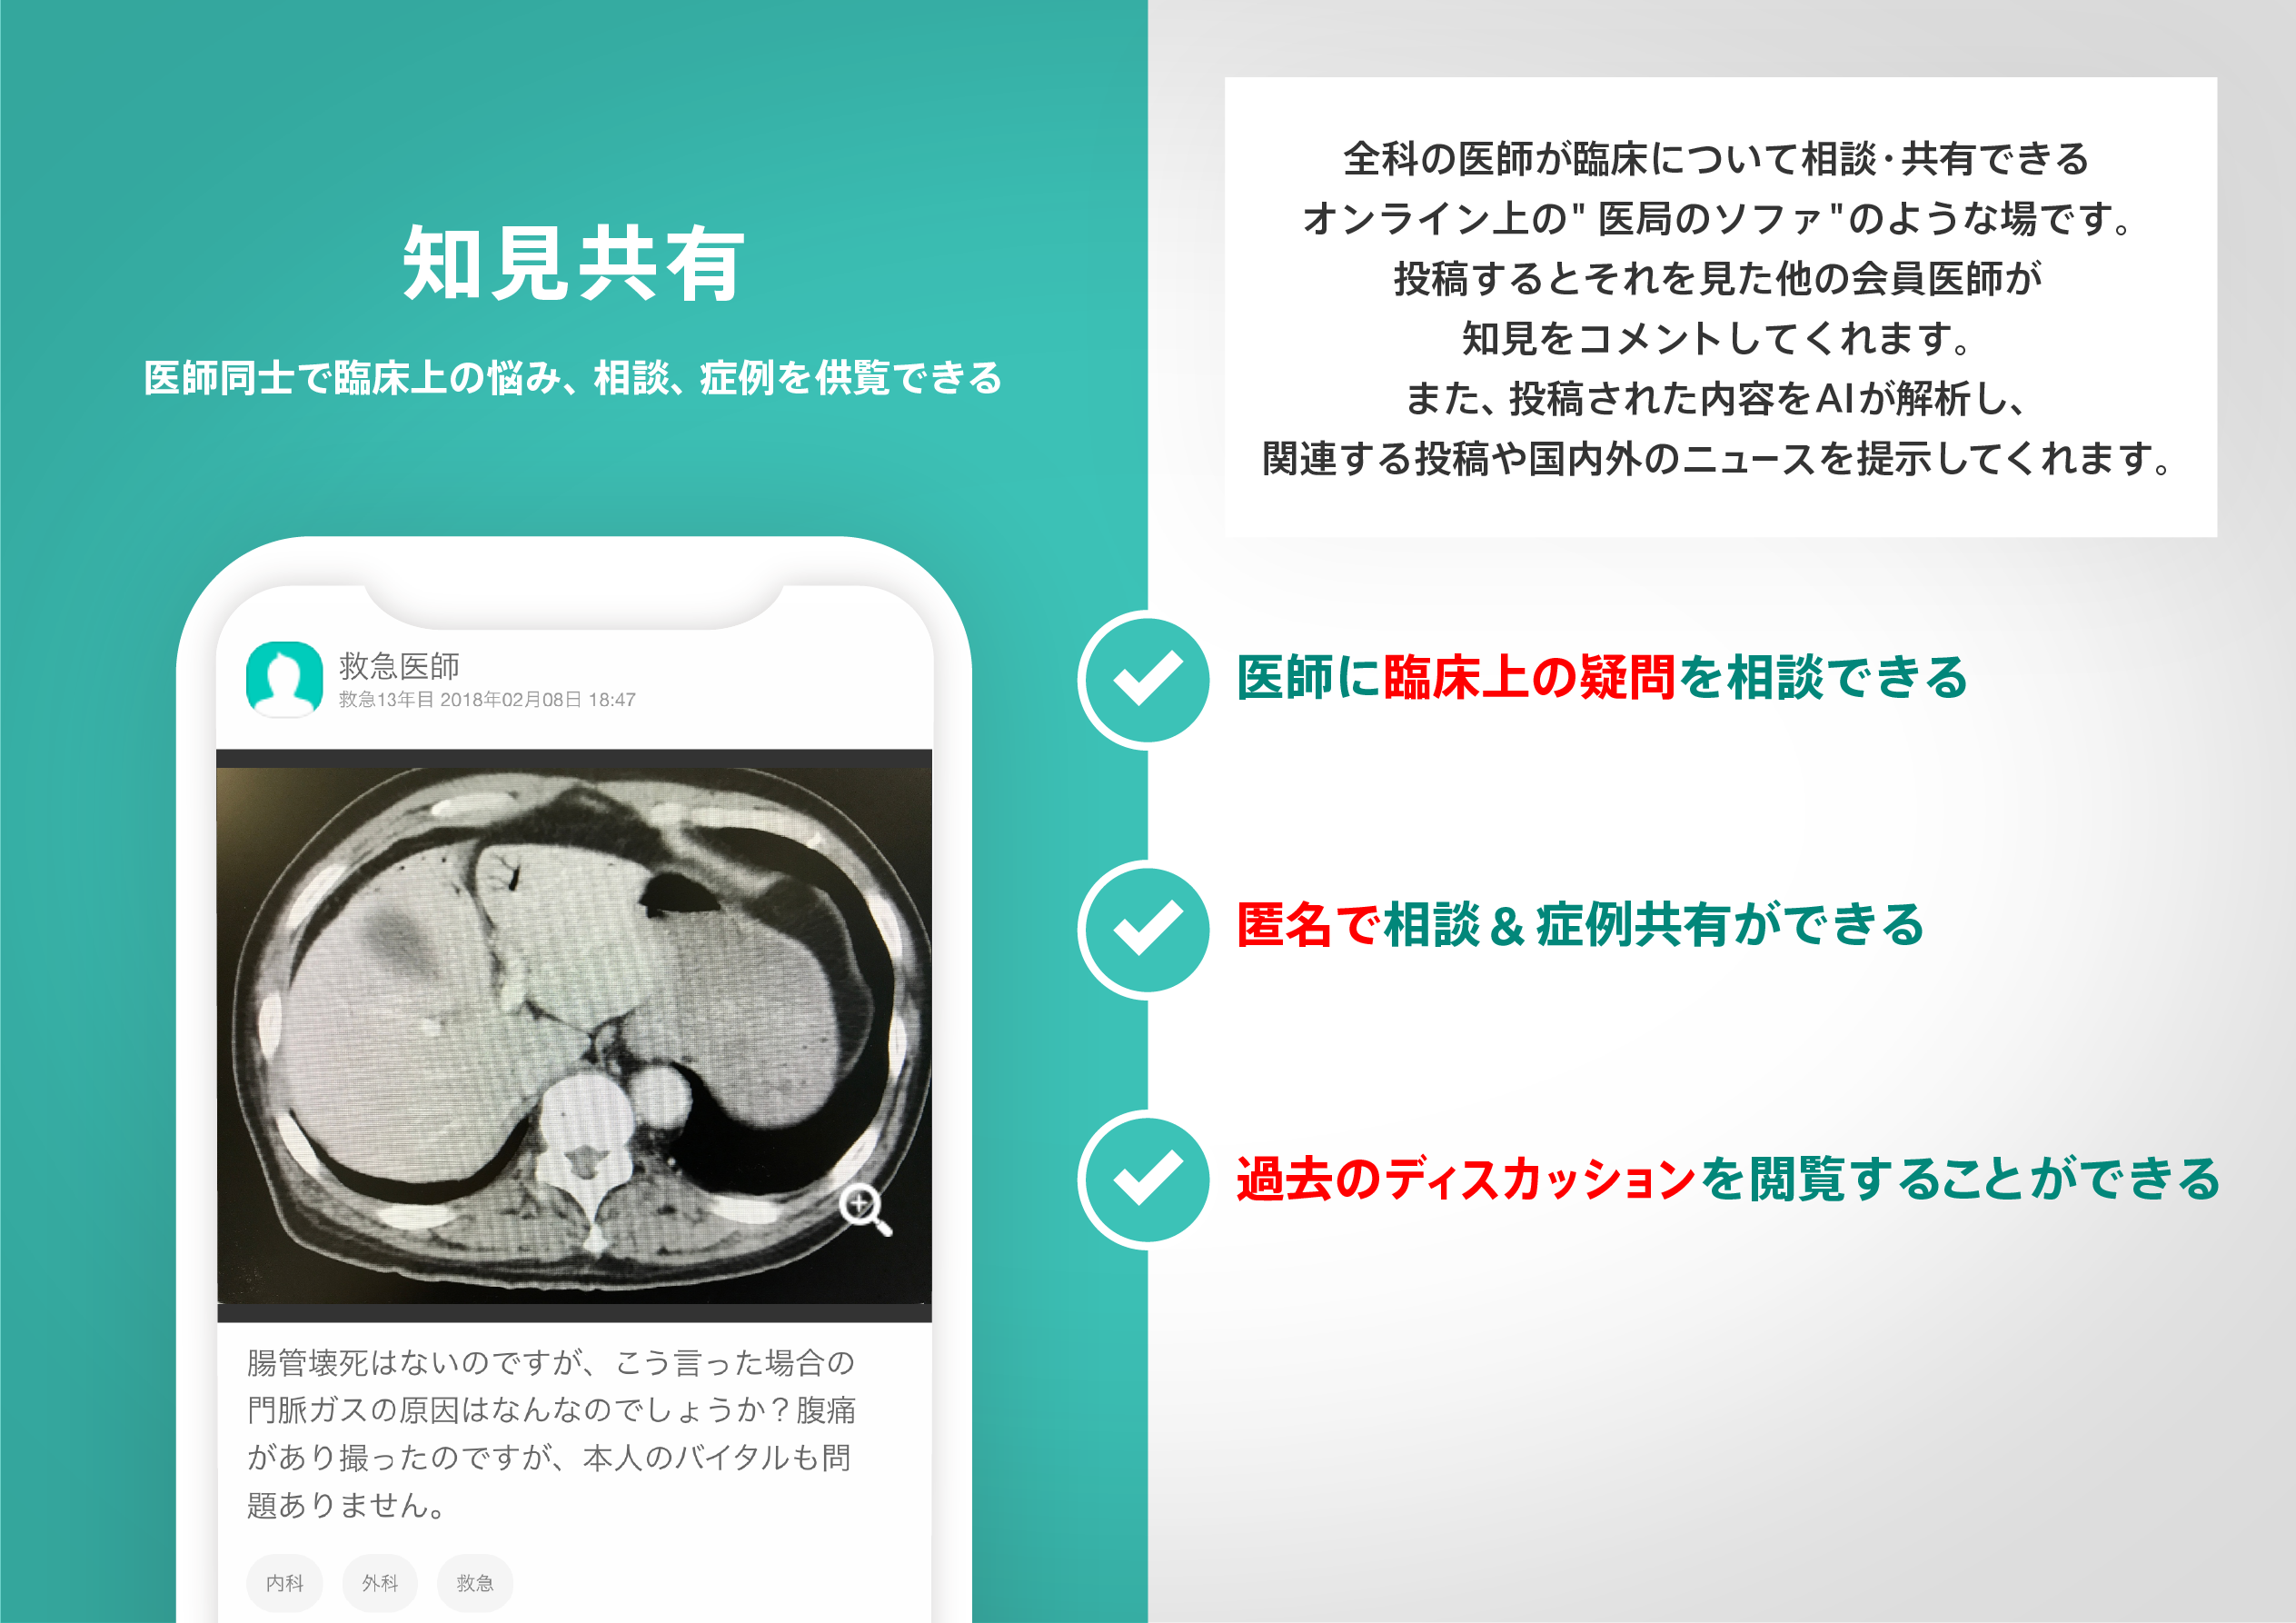
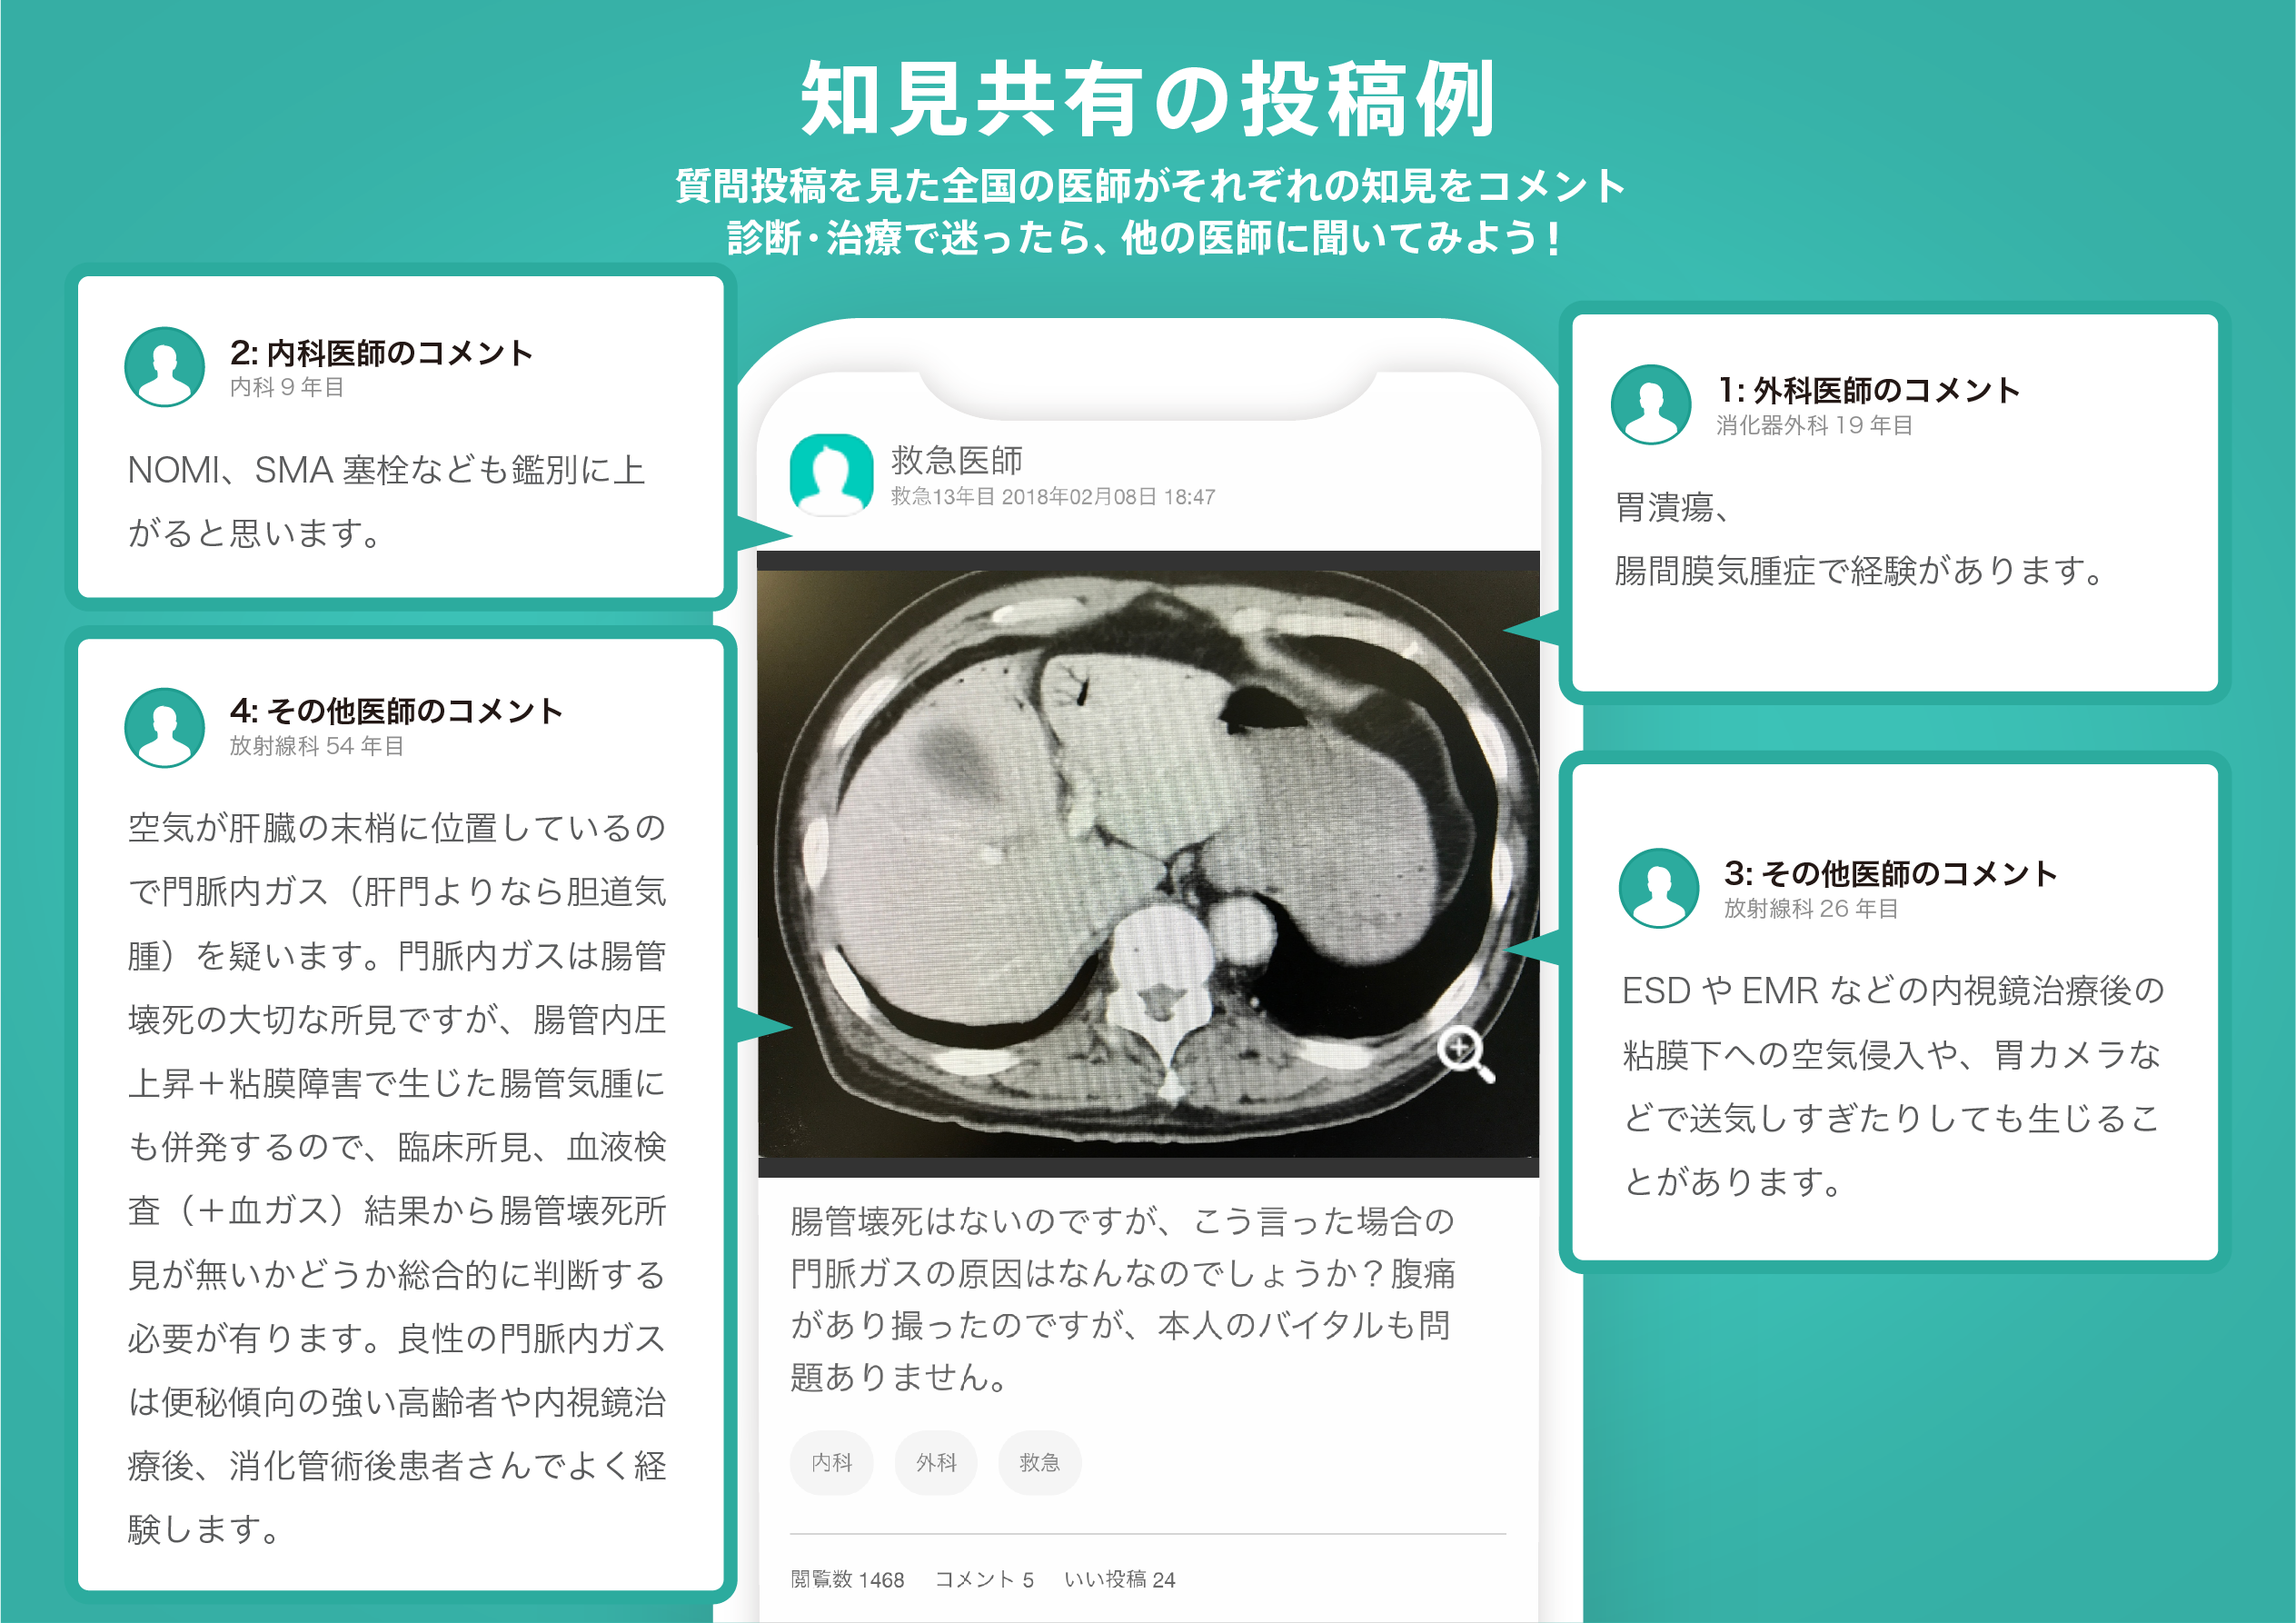
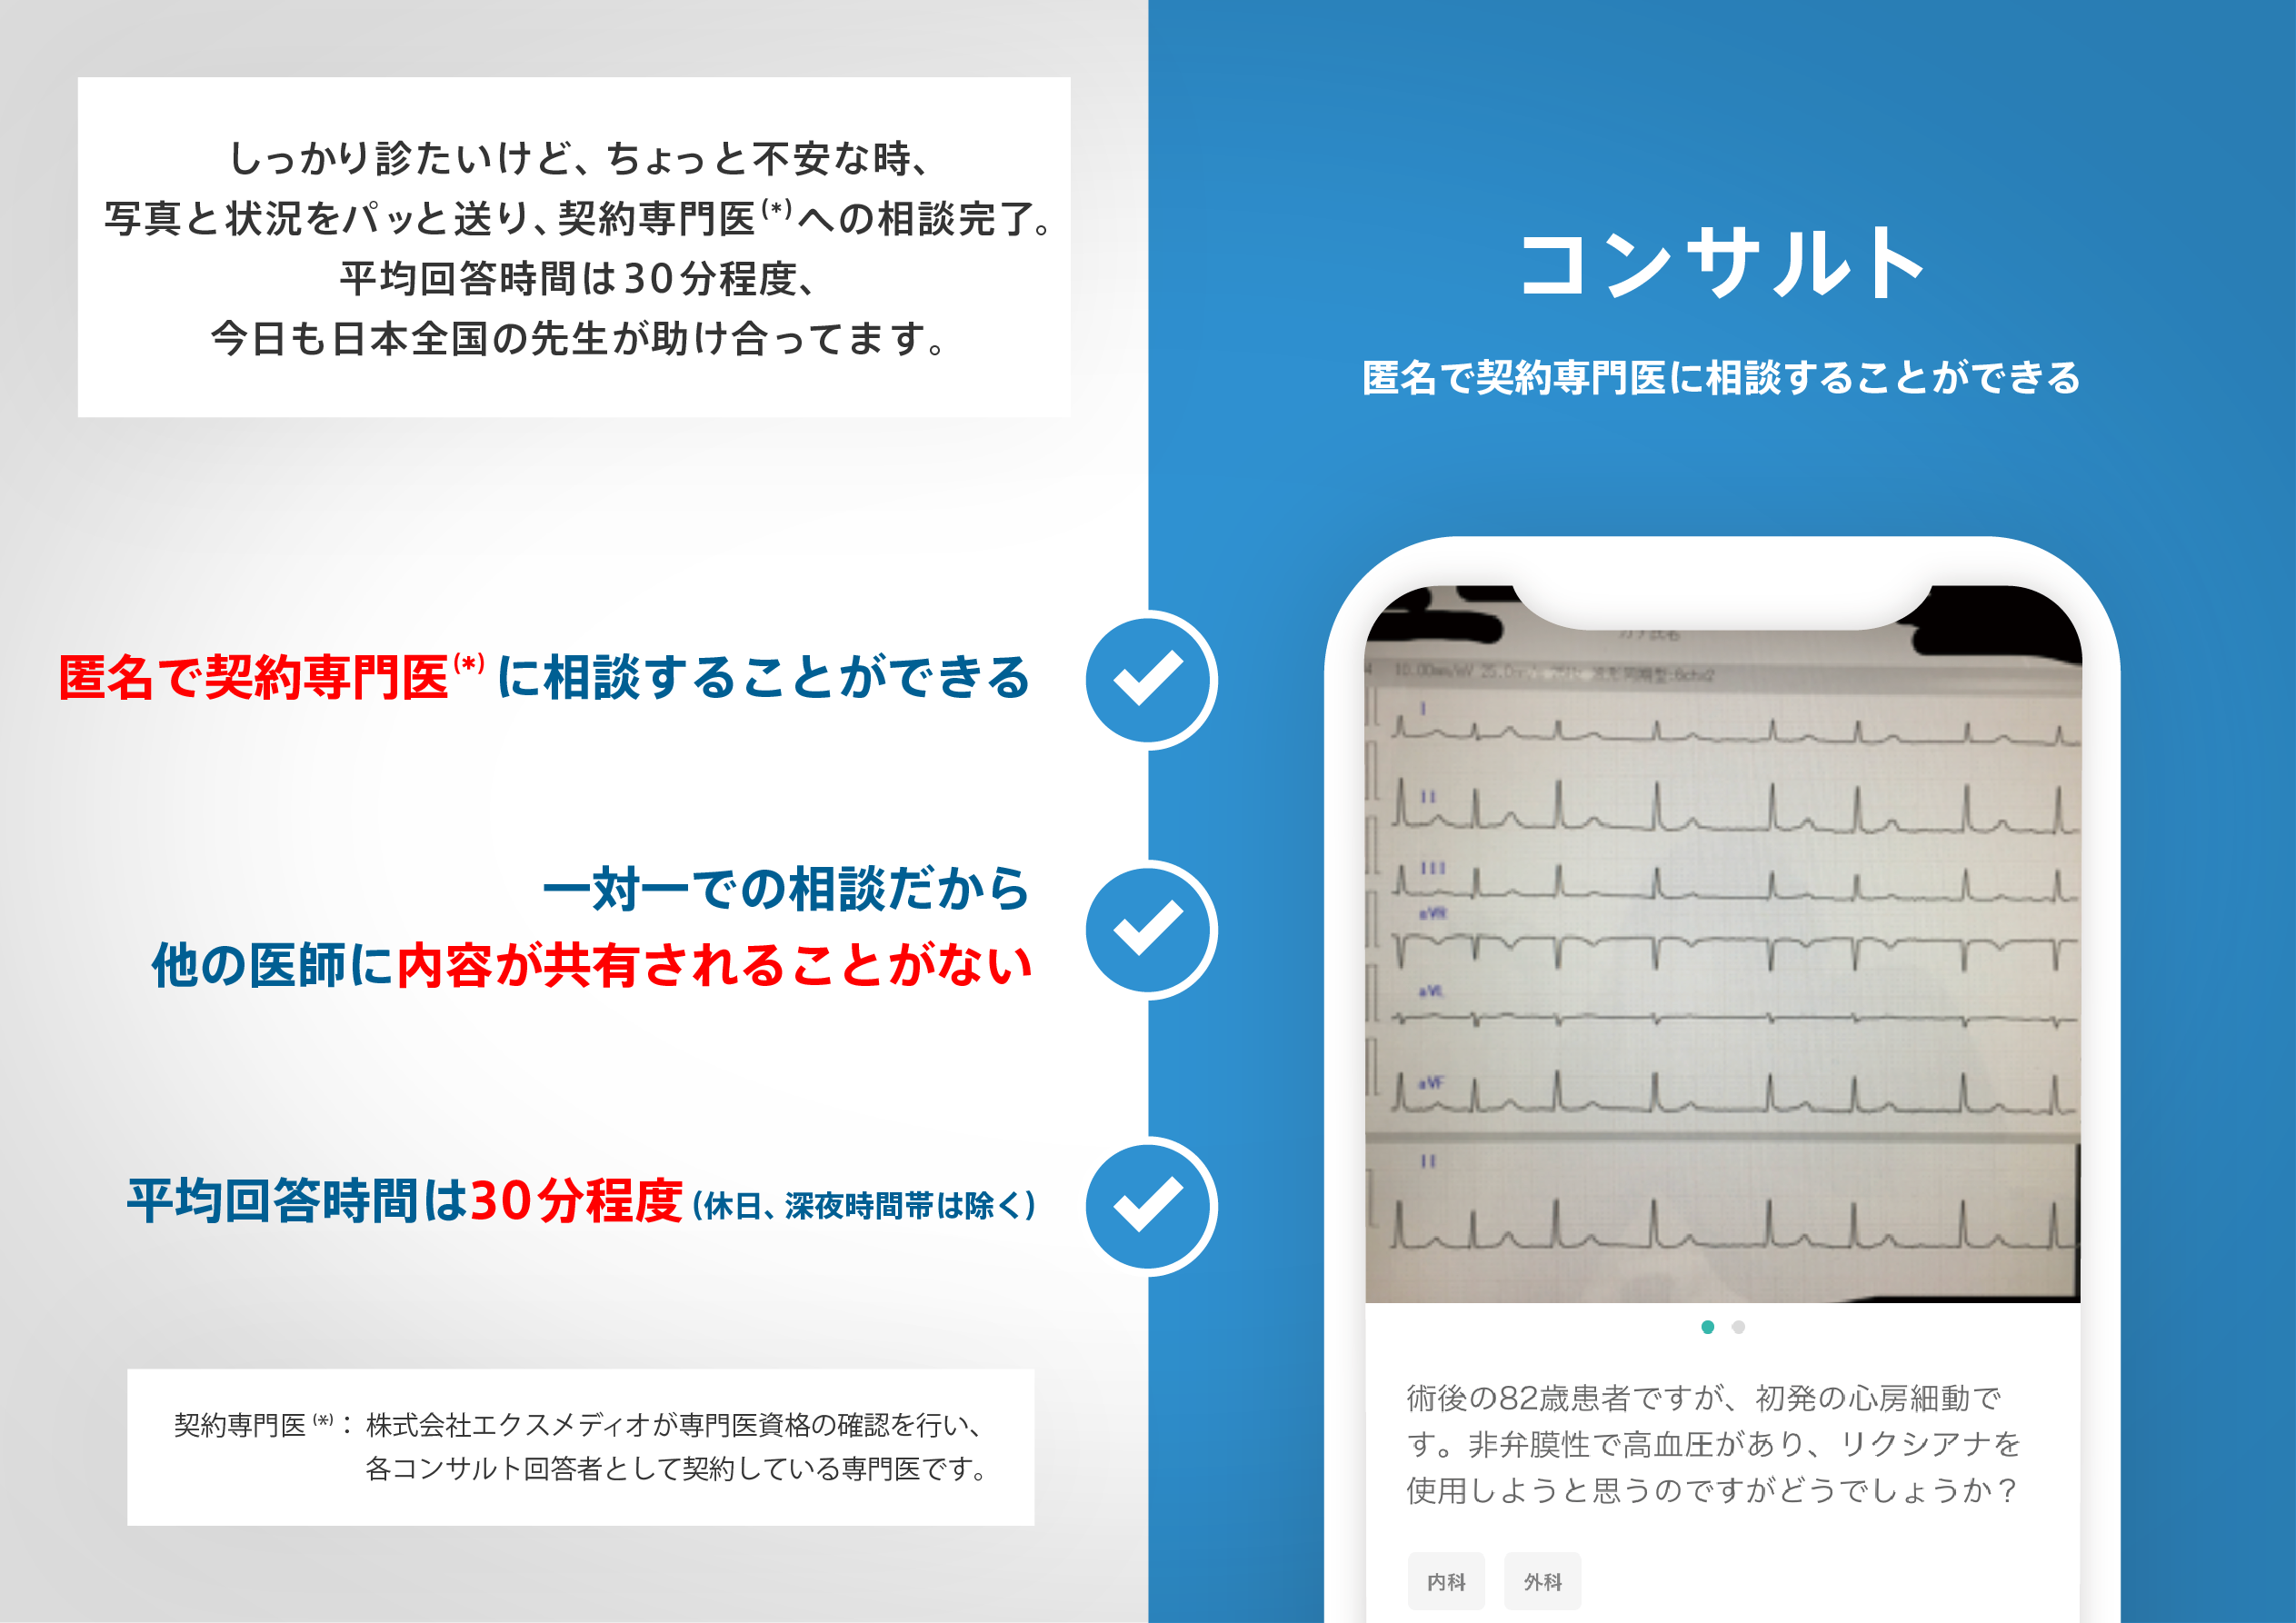
医師のための臨床サポートサービス
ヒポクラ x マイナビのご紹介
無料会員登録していただくと、さらに便利で効率的な検索が可能になります。

